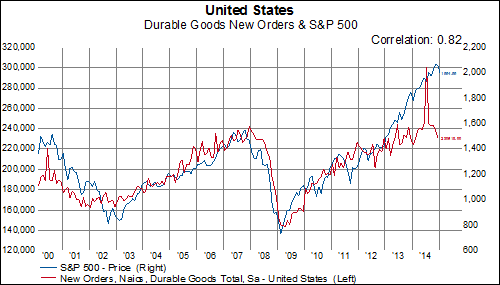
Many remove transportation items from the report to smooth out fluctuations and get a better read on core durable goods orders. We don't see much of a statistical difference, as the level of non-transport durable goods also has an 82% correlation with the S&P 500.

The Citigroup Economic Surprise Index is a short-hand way to keep track of all economic data. It is calculated as a diffusion index and generally oscillates between -100 and 100. In a different way to look at this indicator, we calculate a moving sum as a proxy for the level of economic activity. The moving sum peaked in February 2014 and has been declining since. In looking back over the last ten years, we've never seen such a big divergence in the direction of these two series.

