Gavekal Capital: 2013

Monday, December 30, 2013

Who Won and Loss The Holiday Week

Let's take a quick tour of who had the best and worst performance in the light trading week last week. We will start bottom-up and work our way up to the aggregates (and as usual all aggregate data is equal-weighted).

Top Performing Companies
image

Worse Performing Companies
image

Top Performing Sub-Industries
image

Worse Performing Sub-Industries
image

Top Performing Industries
image

Worse Performing Industries
image

All Sectors
image

Monday, December 23, 2013

Is 2% Growth The New Normal For Consumption?

From 1960 to November 2007 (the 2007-2009 recession started December 2007 according to NBER), real personal consumption expenditures grew at just about 3.5% trend growth. In this recovery, consumption as only mustered a growth rate just above 2%. Is this another permanent downshift in consumption growth or will consumption ratchet back up? Something we will be keeping an eye on.

image

image

Last Week's Returns Had "Risk-On" Characteristics

Last week, the two factors with the highest R-squared to the market were correlation with the Yen and beta. Interestingly, there has been a very clear relationship when looking at stocks with high or low correlation with the Yen over the past year. The stocks with the highest correlation have performed much worse than the stocks with the lowest correlation. This, however, has not been the case when you are dissecting returns based on beta. There hasn't been much of a pattern that you can clearly identify over the past year.

image

image

image

Friday, December 20, 2013

European Energy Sector Performance

Unless there is a strong turnaround over the next ten days, stocks in the European Energy sector will be the worst performers (and the only sector to decline) over the last year:

image

Of the two Energy companies that pass our Knowledge Leaders screen, relative performance does not look as though it is about to improve anytime in the near future:

image
image

Besides a Spanish bank (Bankia) and a mining company (Fresnillo), CGG Veritas is the worst performer in the MSCI Europe over the last year:

image

Intellectual Property Helps Boost 3Q Real GDP Over 4%

The final revision for 3Q GDP surprised to the upside this morning as real GDP increased at an annualized rate of 4.1%. This is just the second time that real GDP has grown at a +4% clip in a quarter in the post-2008 recovery.

image

One of the bright spots of the report was the contribution from intellectual property products. Anyone that is familiar with our firm knows how happy we are that a portion of intangible investments are finally being included in the calculation of GDP (click here for our conference call "Intangibles Go Mainstream" for more information). IP products contributed 22 basis points to real GDP which is the most since 3Q 2010.

image

Looking forward to the fourth quarter, the most recent ISM manufacturing and non-manufacturing surveys, as well as other leading indicators, are indicating that next quarter is on a similar trajectory as the previous quarter.

image

image

Macro Factors Front and Center Again This Week

Our factor scoring work is showing macroeconomic factors to be the main driver of stock price returns again this week as they hold seven of the top ten spots. This is unsurprising given the knock on effects from the Fed's tapering decision on Wednesday. Yet, it is a good reminder of the kind of market we are still faced with as we head into the fifth year of this recovery.

Below we show the top ten best performing factors on a 1 Week basis, sorted from highest to lowest.

image

Thursday, December 19, 2013

Gold Trading Below $1200 for First Time Since 2010 as the USD Gains vs the Yen

Gold isn't taking tapering so well this morning. It is down about 3% so far and is at levels not seen since mid-2010.

image

image

Meanwhile the USD is strengthening with the main casualty being the yen. With Fed tapering now a reality, the BOJ may be able to effectuate round 2 of its currency depreciation game.

image

image

Who Will Win, Bernanke Or The Bank of Japan?

Over the last decade, a strengthening Yen has been associated with a steepening US Treasury yield curve, and the logic is pretty simple: when the Yen is strong, there is less competition  for American producers, and this in turn stimulates nominal economic activity.  When the Yen is weakening, on the other hand, American producers face price competition which manifests itself in lower inflation expectations and a flattening yield curve. 

We are at an interesting juncture, with the US Federal Reserve having begun its tapering sequence.  The Yen, this morning, is at 104.16, which takes out the 103.5 low reached on May 22--the day before the "taper" was first used by Bernanke.  

If the Yen continues to fall, history would suggest this is the backdrop for a flattening yield curve.  Bernanke and the BoJ are trying hard to create domestic inflationary expectations, and only one can succeed.  As the yen hits new lows, initial reactions to the tapering announcement would seem to suggest the Bank of Japan is gaining the upper hand.  We are watching the $/Yen and the US Treasury yield curve for clues.

image

Existing Home Sales Are Now Negative Year-Over-Year For The First Time Since June 2011

This has been a weak dominated by housing related data for the United States. We have seen a the NAHB HMI rise and housing costs boosting CPI and housing starts break a million but mortgage applications breaking down.

Today we have existing home sales falling to an 11-month low in November. While not a surprise given the fall in pending home sales, it is eye-catching that existing home sales have fallen for the past four months. Regionally, the West was the weakest falling to it's lowest sales level since July 2011. The good news is that existing home supply has seem to found footing around 5 months supply for most of 2013 (a level similar to pre-housing boom) and house prices remain higher than they were a year ago.  Lots of charts below.

image 

image

image

image

image

Wednesday, December 18, 2013

Yen Weakens to Lowest Level Since 2008 as Nikkei Goes Vertical

The yen sold off by 1.4% today on Fed tapering and is now trading at the lowest level versus the USD since mid-2008. This result produced a near instantaneous vertical ramp in Nikkei futures, which are currently trading up 2.4% off the session lows.

image

image

We've conjectured in the past that yen weakness has been a significant driver of falling producer price inflation in the US (since this causes Japan to export its chronic deflation), so another sell off of the yen could pose an even greater deflationary threat.

image

Housing Starts Break A Million While Mortgage Apps Break To Nearly 14-Year Lows

We had three month's worth of housing starts data released this morning due to the government shutdown in October. The number of new units started broke the million level for the first time since 2008. Three of the four regions saw increases in November (the Northeast remains the weakest). Building permits were also higher, however, only marginally compared to large increase in housing starts.

image

image

Unfortunately, on the mortgage front the data was more discouraging for the housing market. The MBA Mortgage Application series broke to it's lowest level since the week of December 29, 2000. The Purchase Applications index fell to it's lowest level in nearly a year as well.

image

image

image


Spanish Banks' Non-Performing Loans

On the bright side, the level of non-performing loans this November (grey bars) failed to surpass last year's all-time high, albeit by a very small margin:

image

Unfortunately, the proportion of doubtful debtors relative to total lending (red line, below) continues to rise:

image

For the Spanish banks that are included in the MSCI Europe, long-term debt as a percent of capital (top table) shows no signs of slowing while free cash flow as a percent of sales (bottom table) appears to have taken a turn for the worse:

image

image

Meanwhile, finance ministers are still debating the necessary attributes of a common bank failure resolution mechanism.

Tuesday, December 17, 2013

Checking in with Dr. KOSPI

South Korea's KOSPI stock index is often viewed as a barometer for global growth because of the country's important position in the global supply. Thus, the KOSPI index is often referred to as Dr. KOSPI. So what is Dr. KOSPI's prognosis of the global economy today?

Well, the KOSPI has been persistently underperforming the S&P500 all year, but it certainly is not without the company of most global stock indexes.

image

On a nominal basis, the KOSPI has failed to breakout to new cycle highs, however.

image

We wonder how much of this underperformance is due to added pricing pressure from Japan as a result of the yen's depreciation over the last year. For now the yen has stopped its depreciation relative to the won, but it's largely up to the BOJ to determine how long this lasts. South Korean manufacturing would certainly stand to benefit from a stabilization of the yen.

image

image

Transparency Can Be Tricky

Most MSCI Europe banks declined today, in the wake of the release of the European Banking Association's release of its 'transparency exercise' results (details here):

image

The survey, completed by 63 banks across Europe, did not include a stress test component; it was, however, designed to provide information on the banks' capital positions, the composition of their risk weighted assets, exposures to sovereigns, credit risk, market risk, and loan to value of portfolios.  Most of these variables have shown some improvement over the last few years.
However, as individual countries' finance ministers continue to struggle in negotiations over a pan-European bank resolution mechanism, stocks remain in generally weak trends that look something like this:

image

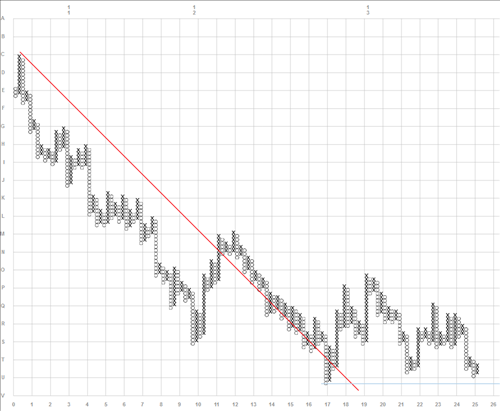
While many have stopped declining relative to the MSCI World Index, they have yet to find the strength to outperform.

Housing Market Index Is Up, Should Help Buoy CPI

The NAHB Housing Market Index increased to 58 to post the highest number since August, which is also the highest level of the recovery. The HMI correlates pretty well with house prices. And house prices, in turn, tend to lead CPI Owner's Equivalent Rent. Thus, this is an important release today because housing makes up nearly 1/3 of the CPI index for United States. So even though inflation may be looking dangerously low from a headline level (as it printed a low 1.2% year-over-year gain today), stronger housing prices and rent should help keep the US out of outright deflation.

image

image

image

image