GaveKal Capital’s Eric Bush
takes a look at what’s driving the energy sector’s seemingly compelling
valuations. If you’re considering buying energy stocks, check out this analysis
first.

Thursday, November 6, 2014
Euro Falls to Lowest Level Since August 2012
Circling back to a topic we have addressed previously (here and here), today's plunge in the EUR/USD exchange rate puts it back on track towards syncing up with the interest rate differential between corresponding spreads:

Having narrowed the gap that developed late last year, how much further might the euro fall?

Having narrowed the gap that developed late last year, how much further might the euro fall?
Retail PMI Offers Little Consolation in the Wake of Disappointing Retail Sales
Following yesterday's rather disappointing retail sales data release, Markit's Retail PMI data (released today) were not very inspiring either:

While Germany managed to register marginal growth, the rest of the region's major economies remain below 50, indicating continued contraction:

Employment fell for the first time since May:

And prices paid remain subdued, reaching an average of 60-month lows on a individual country basis:


Actual sales versus expected sales rebounded somewhat but remains at very low levels while gross margins continue to shrink:


While Germany managed to register marginal growth, the rest of the region's major economies remain below 50, indicating continued contraction:
Employment fell for the first time since May:
And prices paid remain subdued, reaching an average of 60-month lows on a individual country basis:
Actual sales versus expected sales rebounded somewhat but remains at very low levels while gross margins continue to shrink:
Wednesday, November 5, 2014
Valuation Update: Stocks are (Still) Expensive Everywhere
Given the non-correction-correction that took place in October it should be no surprise that valuations didn't exactly correct either. Indeed as we look across countries and sectors it is clear that the valuation level of the median stock is still near the cycle high, which in many cases is higher than the valuation high in 2007-2008. Below we show the price to cash flow ratio to illustrate the valuation extension, but any ratio would do.


Country Allocation Has Been Extremely Important For Equity Investors
Somewhat surprisingly, the percentage of stocks that outperform the MSCI World Index over a short-term horizon, say 200 days, stays in a fairly tight range of approximately 40-60% in general. Currently, only 45% of stocks in the MSCI World Index have managed to outperformed the MSCI World Index over the past 200 days. What is more interesting, however, is how important country allocation has been in finding stocks that have outperformed. Only three out of 24 (12.5%) developed country indices have more than 50% of its stocks outperforming the MSCI World Index. Those three country indices are Australia (57%), Hong Kong (74%), and USA (67%). 17 out of the 24 (70.8%) country indices have less than one-third of its stocks outperforming the MSCI World Index. For comparison purposes, consider that nine out of the 24 (37.5%) industry groups have more than 50% of its stocks outperforming and only five out of the 24 (20.8%) industry groups have less than one-third of its stocks outperforming the MSCI World Index. Investors have been far more likely to pick the correct industry group allocation than the correct country allocation this year. Some of the more interesting charts on these stats are below.


Tuesday, November 4, 2014
Despite Rally in Stocks, Yields Still Low and Speculators Still Short Treasuries
Despite the powerful rally over the last several weeks that brought the US equity markets back to their all-time highs, treasury yields are up only slightly and are well below mid-September levels.
Meanwhile, speculators are still carrying a hefty short position in 10-year treasury futures and options contracts, implying that yields have further to fall yet. Speculators are currently short about 160,000 contracts. Over the last several years, significant lows in yields have not been achieved until speculators became net long about 100,000 contracts, implying a 260,000 long contract delta that would need to be filled to achieve a low in yields (1st chart below). Simply put, if history is a guide we are going to have to observe a massive change in positioning before yields make a low.
What does this mean for stocks? The second chart below overlays the 10-year treasury yield over the relative performance of counter cycle stocks to cyclical stocks. As yields fall, counter cyclical stocks tend to outperform cyclical stocks and vice versa. Thus, if yields continue to fall we are likely in for more of the same dynamic we've seen all year, which is counter cyclical leadership in the stock market.
Cheap Stock Ideas In Japan
Our Gavekal Knowledge Leaders Developed World Index (KNLG, see here for more information) is an equal weighted index of the developed world's most innovate companies. Relative to the MSCI World Index, our index has a couple significant country differences: 1) we are fairly underweight companies in the US and 2) we are very overweight companies in Japan. In the table below, we identify the weighting by country in the KNLG index, then the weights in the MSCI World Index and lastly the difference.
Country Allocation of Gavekal Knowledge Leaders Developed World Index (KNLG)

Because of our structural emphasis on Japan, we spend a good portion of time sifting through Japanese stock ideas. In Japan there is no shortage of statistically cheap companies. In the tables below we show Japanese constituents of our KNLG index that are under 5x intangible adjusted cash flow. We deduct from current period income all the intangible investments that companies make (like research and development, employee training or advertising) in order to arrive at our measure of intangible adjusted cash flow.
KNLG Japanese Consumer Discretionary

KNLG Japanese Consumer Staples

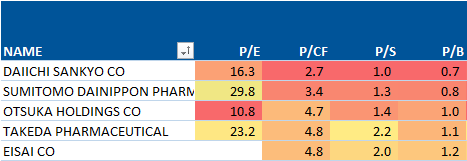
KNLG Japanese Health Care
KNLG Japanese Industrials

KNLG Japanese Technology

KNLG Japanese Materials

Country Allocation of Gavekal Knowledge Leaders Developed World Index (KNLG)
Because of our structural emphasis on Japan, we spend a good portion of time sifting through Japanese stock ideas. In Japan there is no shortage of statistically cheap companies. In the tables below we show Japanese constituents of our KNLG index that are under 5x intangible adjusted cash flow. We deduct from current period income all the intangible investments that companies make (like research and development, employee training or advertising) in order to arrive at our measure of intangible adjusted cash flow.
KNLG Japanese Consumer Discretionary
KNLG Japanese Consumer Staples
KNLG Japanese Health Care
KNLG Japanese Industrials
KNLG Japanese Technology
KNLG Japanese Materials
Longer-Term Implied Inflation Expectations Haven't Rebounded With Bond Yields
On October 16th, the US 10-year treasury yield closed at 2.15% and the US 30-year treasury yield closed at 2.93%. Since then, the 10-year has widened by 21 bps and the 30-year by 14 bps. Interestingly, the move up in yields has not been due to an increase in inflation expectations. 10-year TIPS implied breakeven inflation has increased by only 7 basis points and 30-year TIPS implied breakeven inflation has increased by only 3 basis points since October 16th. As inflation expectations have dropped, the market has pushed out its expectation of when the first rate hike will occur. According to Federal Funds Futures, the market is pricing in a Fed Funds Rate of just 10 basis points for January 2015 and 17 basis points for June 2015.


Subscribe to RSS
Posts (Atom)