Gavekal Capital: 2014-03-30

Friday, April 4, 2014

Technically Speaking: Europe

Regular blog readers are familiar with our use of various technical indicators related to the markets.  While we do not rely on any single measure in forming opinions, they help give us a broad perspective on market activity over a variety of geographical areas and time slices.  The following is a brief review of the technical picture in Europe today, touching on various examples of performance, breadth, and valuation.

As mentioned earlier this week, individual stock performance across all MSCI regions seems to be struggling a bit--even as the indices themselves push to new highs:

image

The 200 day advance/decline ratio for MSCI Europe remains at low levels, indicating that ~75% of stocks in this group were up over the last 200 days while the other 25% were down:

image

image

Breadth of participation has been generally strong for quite some time now, with the Energy, Consumer Staples, and Health Care sectors lagging a bit:

image

image

New 20-day highs are easier to come by than new 200-day highs, led by constituents in the Energy and Financials sectors:

image

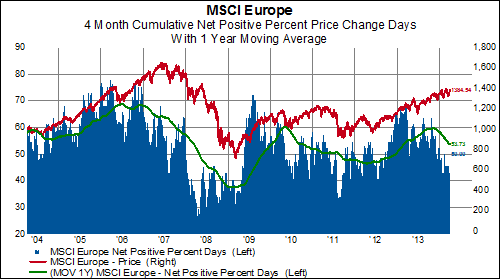
Net positive price change days have diminished, especially since the beginning of the year:
image

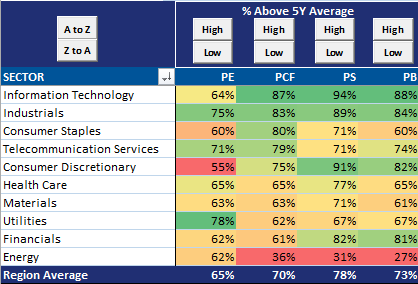
Turning to valuations, 70% of stocks in MSCI Europe are above their five-year average P/CF.  In all but one sector (Energy), at least 60%--and up to 87%--of constituents exceed that measure:
image

image

The bottom line: MSCI Europe looks pretty extended on a technical basis-- with a few cracks beginning to surface?

A Visual Tour Of Today's US Employment Report

The headline nonfarm payroll number for March came in slightly below consensus at 192K (consensus was looking for 206K). Perhaps more importantly, however, the prior two months were both revised higher by a total of 37K jobs.

Regular readers of our blog know that to us the most important number out of the monthly employment report is actually three components multiplied together: payroll employment, average weekly hours, and average hourly earnings. This has been termed national income proxy. On a quarter-over-quarter annualized rate, national income proxy rose by 6.48%, the highest rate since May 2010.

image

image

image

Nonfarm private payrolls also increased by 192K and are about 2% higher year-over-year. Private payrolls are now at an all-time high.

image

image

The unemployment rate held steady at 6.7% while the participation rate increased slightly to 63.2. The household survey increased by 476K jobs.

image

image

image

Unemployment rates for people who have a high school degree is at the lowest level since September 2008.

image

The labor force has increased slightly year-over-year by 0.73%.

image

image


Thursday, April 3, 2014

Stock Indices Made New Highs Yesterday but the Average Stock is 10% From Its High

Yesterday we highlighted here the fact that stock indices are making new highs, but individual stock participation in the rally has waned. We showed that the percent of stocks making new 100 day highs has narrowed even though the major regional MSCI indices keep advancing. Today we'll focus on another way to look at broad stock participation which is to measure how far away stocks are on average from their one year high. This idea is that if on average individual stocks are within close proximity to their one year high then participation in the rally is broad, and vice verse. What we find when looking at the data is that the average stock is trading at 90% of it's one year high - which is to say that the average stock is 10% lower than its on year high. This may seem peculiar given that yesterday the MSCI North America, MSCI Europe, and MSCI World Index all closed at or near a new cycle high.

In the first table below we show the sector breakdown and in the second we take a more granular look and show the industry group breakdown. What is clear to us from reading the data is that more defensive and/or later cycle groups seem to be closer to their one year highs than more cyclical/early cycle groups. This fits with the rotation out of Consumer Discretionary and Biotech and into more defensive and/or cheaper names we've seen recently. In any case we'll be keeping an eye on the waning individual stock participation as the indices continue to make all-time highs.

image

image

Europe: Relative Yields

A quick review of yields relative to Germany in the last few years...

Spain
image

Italy
image

Greece
image

Portugal
image

France
image


Let's Review & Reactions to ECB's Interest Rate (Non)Decision

Earlier this week, we saw data releases for consumer prices and unemployment in Europe:

image
image
image

This morning, Draghi announced that key rates would remain unchanged while affirming the ECB's commitment to 'consider all instruments available' in order to cope with 'lowflation' in the Eurozone.  The EUR/USD exchange rate quickly fell:

image
image

French and Italian bonds also fell sharply versus their German counterpart before rebounding, while Spanish yields declined more gradually:

image

Meanwhile, gains in stocks were mixed/ short-lived:

image

1Q14 US GDP Will Probably Disappoint

We had two major economic releases today that suggest that the first quarter GDP in the US may be lower than previously expected. First, the trade deficit unexpectedly widened to $42.3 billion in February from $39.3 billion in January. The consensus was for a slightly narrowing of the deficit. Exports fell by a little over 1% month-over-month and are only about 2% higher year-over-year. This widening of the deficit will add a drag to the first quarter growth rate.

image

image

The second major release this morning was the ISM Non-Manufacturing Index. While the headline series did bounce back from 51.6 in February to 53.1 in March, our approximate GDP-weighted ISM Manufacturing and Non-Manufacturing combined series suggests that US GDP growth could fall back below 2% in the first quarter. One encouraging component, however, was the employment index which snapped back from 47.5 in February (indicating employment was contracting) to 53.60 in March. This is the largest one month gain for the employment series since this series started in 1997.

image

image

Wednesday, April 2, 2014

US 10-Year Yield Closing In On A 10-Month High

With a little trading left to go, the the 10-year treasury bond is about to set a 2 1/2 month high in terms of yield. The last time the 10-year closed above 2.80% was on January 22nd.

image

Stock Indices Keep Making New Highs but Individual Stocks Aren't

A few weeks ago we highlighted here how new highs in stock indices have not been confirmed by the percent of stocks also making new highs. This is a symptom of narrowing individual stock participation in the advance of broad indices and has been going on now for about five months. Here we simply revisit that analysis from a few weeks ago with updated charts showing that yet again we have new highs in stock indices, but a smaller percent of stocks making 1000-day highs.

image

image

image

Japan marches to it's own beat, as usual:

image

US House Prices Rise In February

The latest data out for US house prices show an increase in February according to CoreLogic. Both including and excluding distressed sales, house prices rose in February after stagnating in the latter half of 2013.  Meanwhile, mortgage applications for both purchasing and refinancing remain at depressed levels. Mortgage rates, however, have remained between 4.50% - 4.90% since last May

image

image

image

image

image

Tuesday, April 1, 2014

A Fixer-Upper?

As noted yesterday, March was not an exceptionally positive month for European equities.  One (non-Utility) sub-industry that stood out, however, was Home Improvement Retail.  Considering that this group consists of just one company in MSCI Europe and that the company is in the U.K.-- where housing in general has been quite strong recently-- this might not be all that surprising.  Nonetheless, we took a deeper look into the drivers of Kingfisher's outperformance versus the MSCI World Index after years of lackluster trading.

image

To be sure, the housing market in the U.K. has seen a decent recovery over the last few years, notwithstanding last month's small pullback in mortgage lending:

image
image

Whether programs like 'Help to Buy' are pushing U.K. housing into bubble territory or not, Kingfisher's strong performance is undeniable, even versus its sub-industry peers:

image

image

With the second highest level of cash as a percent of assets and negative net debt on its balance sheet, the company also generates the highest gross margins of the group-- all with the lowest financial leverage:

image

image

image

Of course, we are always eager to see the importance a company places on intangible investments.  Kingfisher doesn't disappoint-- in fact, it invests more than Home Depot or Lowe's when it comes to intangible capital as a percent of sales:

image

All of this and the company still trades at at valuations well below its peers:

image