
Friday, February 14, 2014
Australia Employment Suggests Further Slowing in China
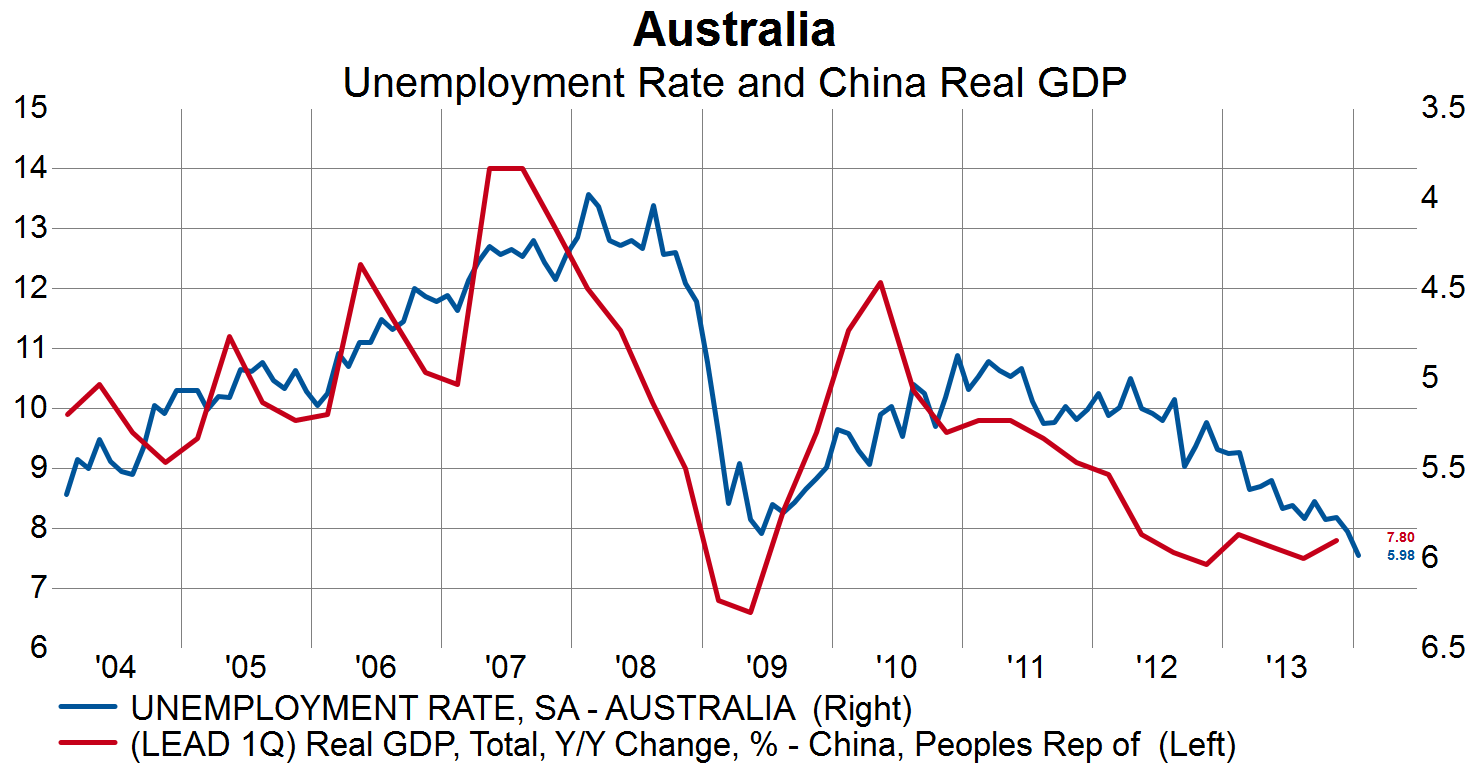
The unemployment rate in Australia increased again last month to 6% signaling a further slowdown in Chinese GDP growth. The logic here is that as China moves away from an investment led growth model (that requires a large amount of natural resources) its level of overall growth must necessarily show. Since Australia is one of China's largest suppliers of natural resources we should see the effects of slowing demand for commodities show up in some of Australia's employment statistics before or coincident to actual slowing in China's economy.
Technical Divergences Persist in World Stock Market
We've highlighted on numerous occasions over the last few months the softening technical backdrop in the MSCI World Index. Since the rally over the last week and a half that has sent stocks back near their all-time highs, we thought it was a good time to review what our indicators are telling us about broad participation in this rally.
In the first chart below we show the cumulative number of net advancing stocks over the last two years (basically it's an Advance/Decline line that is calculated over the last 504 trading days, rather than some arbitrary starting point like most A/D lines) and compare it to the MSCI World Index price. The takeaway here is that stocks have advanced back to near their all-time highs, but our A/D line has continued to head in the opposite direction despite the recent blip higher.

This next chart shows the percent of all stocks making a new 65-day high and compares it to the price of the MSCI World Index. The blue line (our technical indicator) has not made a new high since last October and in fact keeps making lower highs and lower lows. So far we have seen more of the same in this latest buy-the-dip episode (i.e. the percent of stocks making a new 65-day high has not expanded all that much while the aggregate stock market is back near the all-time high).

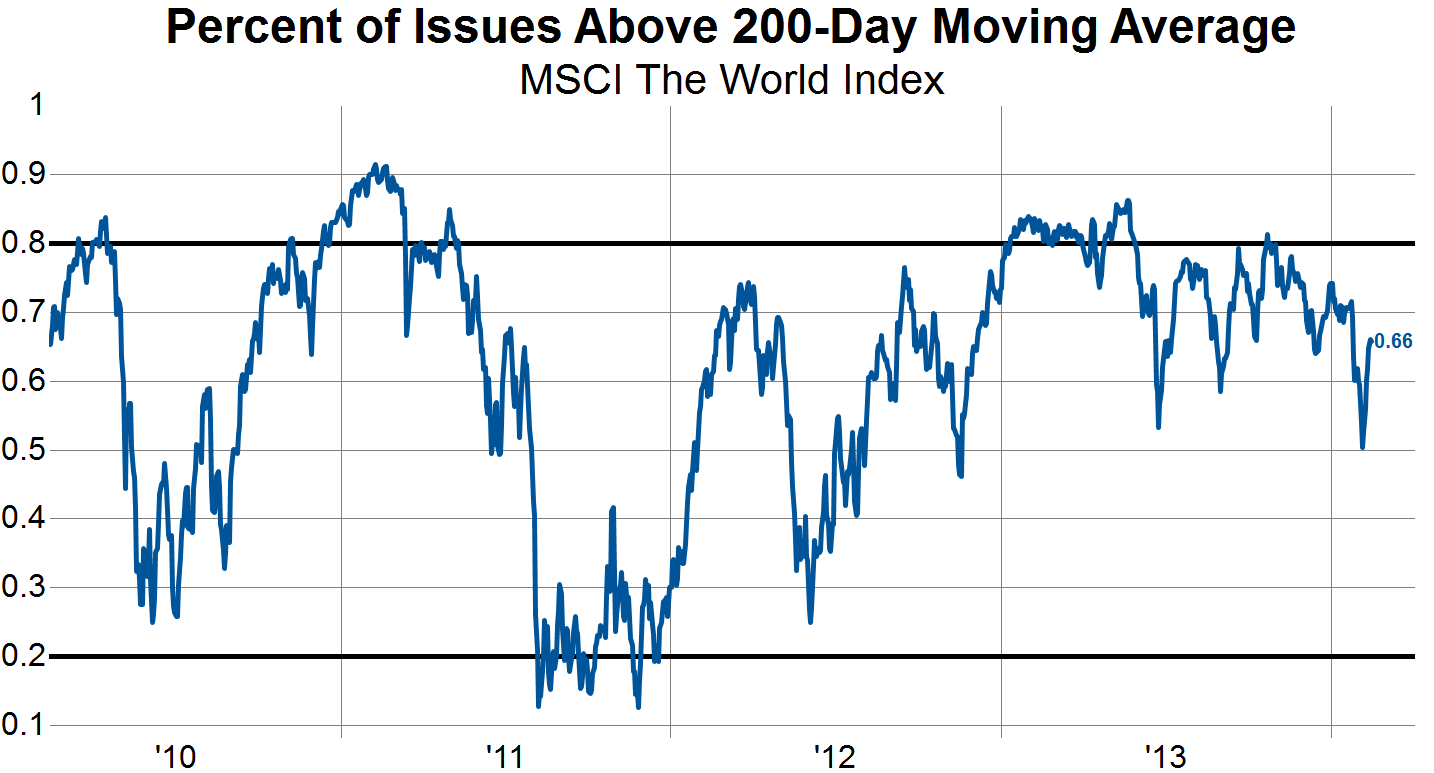
The final chart in this post shows the percentage of stocks trading above their respective 200-day moving average. We see that this indicator peaked out towards the beginning of 2013 and has since seen a series of lower highs and lower lows. The latest rally has so far failed to bring this indicator back to the previous high made in early January.
These technical breadth indicators are by no means timing tools, but they do shed light on the broad participation in rallies or declines in the stock market. We are currently seeing many of these breadth indicators failing to confirm the most recent rally in stocks, which signals that fewer stocks are displaying strong trends than was previously the case. This is the same sort of pattern that occurred in 2011 and thus some caution is warranted as broad indices race higher.
In the first chart below we show the cumulative number of net advancing stocks over the last two years (basically it's an Advance/Decline line that is calculated over the last 504 trading days, rather than some arbitrary starting point like most A/D lines) and compare it to the MSCI World Index price. The takeaway here is that stocks have advanced back to near their all-time highs, but our A/D line has continued to head in the opposite direction despite the recent blip higher.
This next chart shows the percent of all stocks making a new 65-day high and compares it to the price of the MSCI World Index. The blue line (our technical indicator) has not made a new high since last October and in fact keeps making lower highs and lower lows. So far we have seen more of the same in this latest buy-the-dip episode (i.e. the percent of stocks making a new 65-day high has not expanded all that much while the aggregate stock market is back near the all-time high).
The final chart in this post shows the percentage of stocks trading above their respective 200-day moving average. We see that this indicator peaked out towards the beginning of 2013 and has since seen a series of lower highs and lower lows. The latest rally has so far failed to bring this indicator back to the previous high made in early January.
These technical breadth indicators are by no means timing tools, but they do shed light on the broad participation in rallies or declines in the stock market. We are currently seeing many of these breadth indicators failing to confirm the most recent rally in stocks, which signals that fewer stocks are displaying strong trends than was previously the case. This is the same sort of pattern that occurred in 2011 and thus some caution is warranted as broad indices race higher.
Thursday, February 13, 2014
The Median Stock Valuation is Still High Relative to History
One way we like to gauge the general level of valuations is to look at the multiple at which the median stock is trading and compare it history. This method of analyzing the median stock valuation solves two problems:

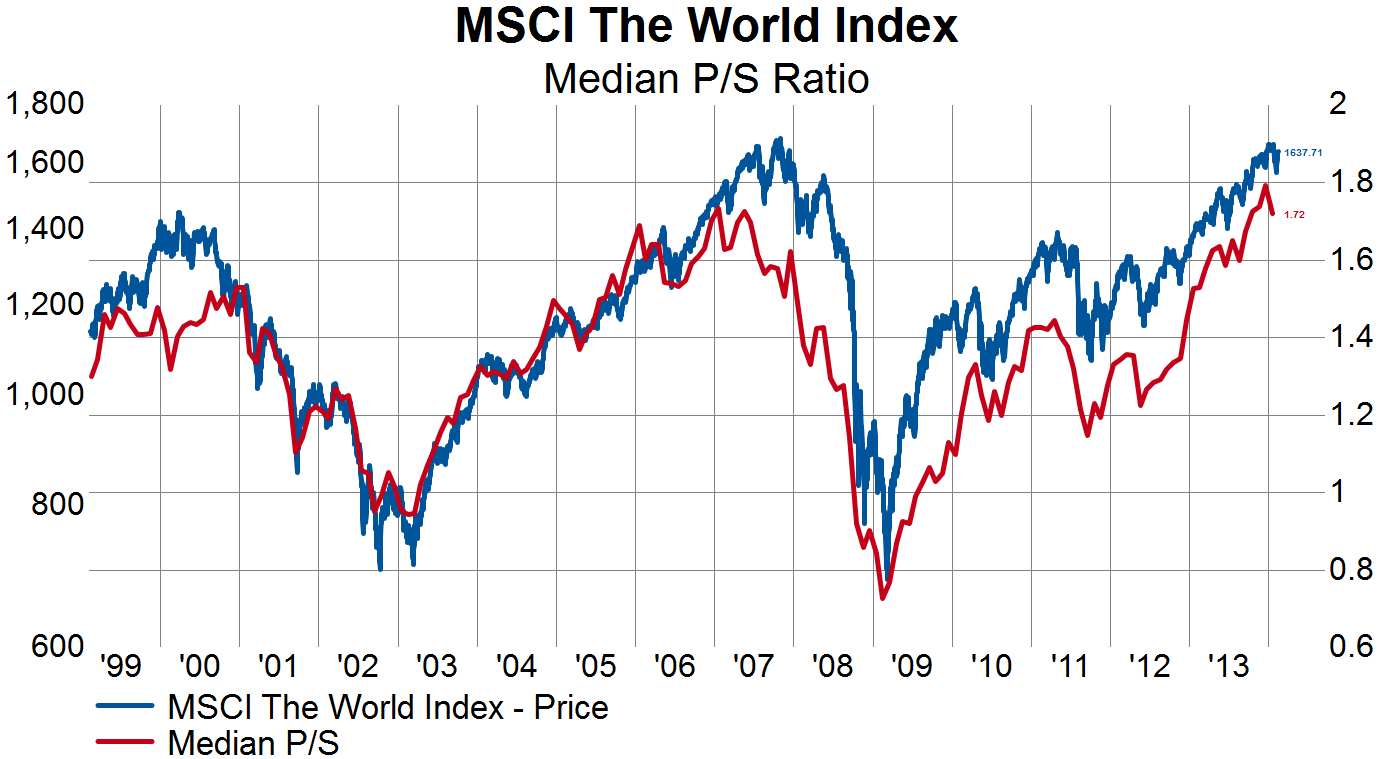

- It greatly reduces the impact of outlier valuations in an average
- It greatly reduces the impact of the largest cap stocks in a typical market cap weighted valuation analysis. There can be times, like now, when the valuations of mega cap stocks aren't terribly demanding (think Microsoft, Exxon Mobile, Apple) and using a market cap weighted valuation approach can give a misleading result for the typical stock.
Early Cyclicals Are Not Back In The Drivers Seat
Early cyclicals have had a tremendous bull run over the past five years. They have managed to outperform the MSCI World Index by over 50% during this time. By far the most of any of our cyclical or counter-cyclical baskets.

We thus take note that in the past week and a half as the equity market has bounced early cyclicals have not exerted themselves back into market leadership. Something that we will keep an eye on.
Some Ugly Declines in Europe Today
The big news seems to be that BNP Paribas set aside over $1B to pay for possible penalties related to transactions that violated U.S. laws. As a result, the stock fell nearly 4% today.


However, while today's decline will not affect the long-term chart for BNP Paribas too negatively, the double-digit declines in Rolls Royce and Tate & Lyle likely will have significant effects on each stock's performance relative to the MSCI World:
Wednesday, February 12, 2014
European Government Bond Yields
Most investors are familiar with the surge in bond yields in Europe's 'peripheral' countries. Those yields have come back down and, in the case of Italy and Spain, are now below levels last seen in 2009/2010:

Even as these GIPSI's yields continue to normalize over the last year...


...the trend of yields in France, Germany, and the U.K. has been more of a slow rise since last spring:


Will the preference for government issues of Italy and Spain continue?
Even as these GIPSI's yields continue to normalize over the last year...
...the trend of yields in France, Germany, and the U.K. has been more of a slow rise since last spring:
Will the preference for government issues of Italy and Spain continue?
US Mortgage Apps Remain Near 13-Year Lows
While 30-year fixed mortgage rates have dropped by about 30 bps to 4.55% after peaking at 4.86% in September of last year, it is somewhat troubling to see that mortgage applications are practically unchanged during this period. Meanwhile the number of real estate credit employes has steadily decreased during this period as well. Finally, the purchase application index has remained range bound for nearly 3 1/2 years and the current reading is at the bottom of that range. We will be keeping an eye on whether or not mortgage applications are able to accelerate as we move into the spring.


Tuesday, February 11, 2014
Does The Small-Cap Breakdown Signal A Weakening Euro/Yen
With an almost 90% correlation, movements in the Euro/Yen have a strong relationship with the relative performance of large cap stocks (SP500) vs. small cap stocks (SP600). In the last week, small cap relative performance has broken down from a three month consolidation. Does this signal a weakening of the Euro/Yen, likely a function of stronger Yen, in the weeks to come? This would be another piece in the puzzle suggesting the global liquidity environment has taken a turn for the worse.

Small Businesses Still Not Feeling Optmistic
While many business surveys are rebound back to pre-2007 levels, one that is still mired in pessimism is the NFIB Small Business Survey. Small Business continue to feel much more depressed than in almost any time prior to 2007 as the index has not been able to overcome the 95 level in over 6 years. One encouraging sign, however, is that the Job Openings sub-component is at it's highest level since January 2008.


French versus German Bonds and the MSCI Europe
Over the last five years, when the short-term moving average of the spread between French and German bonds has fallen below the long-term moving average of the same, MSCI Europe has underperformed. While we are not there yet, it is an interesting relationship to bear in mind as the 25D moving average rolls over:

Monday, February 10, 2014
Breadth Of Sales & Earnings Revisions Best in Asia
One way we keep up with global fundamental corporate performance is by tracking sales and earnings estimates for the MSCI World index. The only tweak we make to the data for over 1,600 companies in developed countries is to equal weight sales and earnings. In this way, all companies, regardless of size, are counted the same. We can then look at the breadth of earnings revisions over different time periods. In the tables below, we focus on the percent of companies in each regional sector with improving sales and earnings estimates.
Over the last month, 49% of the companies in the MSCI Asia-Pacific index experienced positive earnings revisions, while 57% of these companies saw positive top-line revisions too. This compares with only 30% of companies in Europe and 42% of companies in North America that have experienced positive earnings revisions over the past month. Only 27% of European companies saw positive top-line revisions, while 44% of North American companies saw revenue estimates rise.
Sales & Earnings Revision Breadth for Asia

Sales & Earnings Revision Breadth for Europe

Sales & Earnings Revision Breadth for North America

Over the last month, 49% of the companies in the MSCI Asia-Pacific index experienced positive earnings revisions, while 57% of these companies saw positive top-line revisions too. This compares with only 30% of companies in Europe and 42% of companies in North America that have experienced positive earnings revisions over the past month. Only 27% of European companies saw positive top-line revisions, while 44% of North American companies saw revenue estimates rise.
Sales & Earnings Revision Breadth for Asia
Sales & Earnings Revision Breadth for Europe
Sales & Earnings Revision Breadth for North America
Newsmakers in Europe Today
Stocks closed mixed in Europe today. The only big news: Nestle is exploring options for reducing its 29% stake in L'Oreal in order to focus on core competencies in nutrition and health.


Today's +4.5% gain for the cosmetics giant (that regularly invests more than 3% of sales in its R&D efforts) should confirm the stock's breakout from a long-term base of support.
As we noted last November, the European personal products sub-industry boasts attractive fundamentals as well as an improved technical outlook.
Winners and Losers Last Week
Energy stocks led the week higher as the MSCI World as a whole, on an equal weighted basis, was up 0.5%. The worse performing sector was Health Care which was down -0.2%. Information Technology remains the best performer over the past year. Further breakdown of performance below.
Performance by Sector

Performance by Country

Performance by Industry

Best Performing Stocks

Worse Performing Stocks

Performance by Sector
Performance by Country
Performance by Industry
Best Performing Stocks
Worse Performing Stocks
Subscribe to RSS
Posts (Atom)