Gavekal Capital: 2014-11-16

Friday, November 21, 2014

Easy to Make Money When Everything is Up!

Today's price action across all the major asset classes stands out as rather odd. Indeed, stocks are up pretty much everywhere around the world (US, Europe, Japan, China), bond prices are up (yields lower), commodities are higher (gold, energy, lumber, copper, CRB, some softs), and the USD is higher.

image

image

image

image

Trends Developing In The Forex Market

As most investors are aware, there have been some major currency moves recently (looking at you Yen/USD cross). This has established some interesting trends in the forex market. For example, volatility continues to rise off a very low base (unlike in the equity market). In the chart below, we plot the VIX (right-hand scale) against the average 65-day realized volatility of major currency pairs (left-hand scale). Forex volatility has increased to its highest level since November 2013.

image

Some long-term purchasing power parity relationships have also changed. For instance, the Euro is now undervalued on a purchasing power parity basis against the USD really for the first time since 2012. And the Pound is now undervalued again after spending most of 2014 overvalued.

image

image

The Yen is now undervalued against the dollar by the greatest percentage since late 1985.

image

The overvaluations of the commodity currencies such as the Canadian dollar and the Australian dollar have fallen substantially. The Canadian dollar is approximately 5.5% overvalued against the USD on a PPP basis. This is the lowest overvalued percentage since 2009. The Aussie dollar is still 16.5% overvalued but down from 47% overvalued in 2011.

image

image

Finally, the nominal and real trade-weighted dollar index are both at five year highs.

image

image

Thursday, November 20, 2014

European Equity Market Internals: Still Questionable

GaveKal Capital’s Jennifer Thomson reviews 10 market internals for European stocks looking for signs of a rebound. If you’re considering European stocks, check out this analysis first.


Intraday Volatility has Disappeared (Again)

Regular readers know that we have been harping on the lack of volatility all year (few posts here and here) so it should come as no surprise that we are, once again, calling out the absolute evaporation of intraday volatility in US stocks. Indeed, as one of our favorite indicators below shows, the daily trading range of the S&P 500 (calculated as intraday high minus intraday low as a percent of the index level and shown on the right axis, inverted) is again near the all-time lows when one excludes the few days around the end of each calendar year. This indicator did spike higher in October during the mini-correction, but that spike has been entirely erased with the subsequent rally. The last time the indicator was near this level was just before the October swoon started, though we are careful not to extrapolate.

image

If German Yields Break To New Lows, European Cyclicals Will Likely Follow

European cyclicals continue to be the weakest segment of developed global equity markets, and there doesn't appear to be much sign of that changing.  We refer to the extremely strong relationship between German 10 year bond yields and the relative performance of European cyclical sectors.  In the chart below, we plot the relative performance of all cyclicals in the MSCI Europe index compared to the MSCI World index and then compare this to German 10 year yields.  With a 92% correlation over the last five years, the movement of German rates is highly correlated to equity performance trends.

image

Drilling down one layer deeper, we continue be especially weary of European late cyclicals.  In the chart below, we can once again see the close relationship between the relative performance of MSCI Europe late cyclicals and German 10 year rates.

image

After the poor PMI numbers reported this morning, German bond yields were down 5bps to 76bps. This is only 4bps away from the all-time low in German yields of 72bps on October 15, 2014.  If German rates break out on the downside, a new leg of European cyclical underperformance will likely follow.

image

Junk Bonds Not Confirming S&P 500 Record Highs

Since the "666" intraday low, high yield spreads and equity prices have basically moved in lockstep together. As equity prices moved higher, the spread between junk bonds and 10-year treasuries narrowed. As the chart below illustrates, this relationship started to diverge during the summer.  On June 24th, the spread between between high yield bonds and 10-year treasuries narrowed to 222 basis points. Since that day, the spread has widened by 158 basis points to 380 basis as of yesterday. On October 15th, the spread reached 431 basis points which was the widest spread since late 2012. Perhaps most importantly, however, junk spreads have widened back out during November even as the S&P 500 has pushed higher. We are now in a situation where either this relationship has come unhinged or we would need a sharp rebound in credit or correction in equity prices in order to reestablish the status quo from the past 5+ years. We will definitely be keeping our eye on this going forward.

image

Wednesday, November 19, 2014

Only 28% of Energy Stocks Have Positive Performance YTD

In June, 86% of the energy stocks in the MSCI World Index had positive price performance year-to-date. Since that time, however, energy stocks have been clobbered.  In mid-October, only 11% of energy stocks were higher YTD. This has marginally improved to 28% as of yesterday. Overall, however, energy stocks remain the worst performing sector by a wide margin in 2014.

image

MSCI World Index
image

Broadening out our perspective, we see that 55% of all MSCI World Stocks are higher this year as the index is up 2.96% from an equal-weighted perspective. The current percentage of stocks with positive price performance is below the high for the year which was 70% in early July.

image

Not surprisingly as it is by far the best performing sector year-to-day, the health care sector has the most stocks with positive performance this year at 83%. 72% of utility stocks are higher and 67% of information technology stocks are higher year-to-date.

image

image

image

Tuesday, November 18, 2014

Next 12 Month Sales Estimates For MSCI North America Lowest Since 2009

Last week we looked at how sales growth estimates for the next fiscal year are now negative for five of the 10 MSCI World Index sectors. Today, we are again looking at estimates but this time from a forward 12-month perspective. Sales for the MSCI World Index are only expected to grow by 3% over the next 12 months according to estimates (blue line below). This is about 2% lower than expected in July. EPS for the MSCI World Index are expected to grow by 9% over the next 12 months which is about 1.5% lower than expected in July.

image

Looking at this data by region, we find that MSCI Pacific has had the sharpest decline in sales and EPS growth estimates. In July, sales were expected to grow by over 6% over the next 12 months. This has now fallen to just over 1%. Also in July, EPS were expected to grow by 10% and this has now fallen to 6%.

image

Growth estimates for MSCI North America have remained relatively flat. EPS are expected grow by 10% over the next 12 months and sales are expected to grow just under 5%. The current expected growth rate for sales, however, is the lowest growth rate for the next 12 months since 2009  by a slim margin.

image

Finally, expectations for MSCI Europe have slightly improved since the beginning of October. Currently, sales are expected to grow by 3% (up from 2%) over the next 12 months and EPS are expected to grow by 9% (up from 8%) over the next 12 months.

image

Stocks are Advancing on Counter Cyclicals, Knowledge Leaders Leadership

As US stocks continue their march higher we'd like to remind readers of the market leadership in general and especially off of the October low. Stocks have staged a powerful rally, but the leadership has been and remains counter cyclical stocks and Knowledge Leaders, companies that successfully employ knowledge capital to achieve outsized returns. This has not been a "dash for trash" rally, to the contrary. This extremely powerful 10% rally in the span of one month has been led by high quality innovators and stocks with stable cash flows (which are more coincident than mutually exclusive attributes).

image

image

Beyond the Headline in Germany's ZEW Survey

Today's release of the ZEW financial market survey for Germany revealed a surprising increase in economic expectations, compared to the consensus for a marginal improvement:

image
chart note: 
dark blue = balance
red = improve
light blue = no change
black = worsen

Meanwhile, the question on current economic conditions revealed no change from low levels reached a month ago:

image

Inflation expectations and the outlook for interest rates continue to fall, while hopes for an improvement in the DAX have risen, on balance:

image
image
image

Profit expectations are looking brighter in a few industries, led by large increases in the Machinery and Electronics groups.

Chemicals
image

Information Technology
image

Consumer Goods & Retail
image

Services
image

Machine Construction
image

Construction
image

Electronics
image

Telecommunications
image

Conversely, the outlook for Financial, Utility, and Auto industries continues to be less promising, according to the 220 analysts queried in this month's survey:

Vehicle Construction
image

Steel
image

Utilities
image

Banks
image

Insurance Companies
image

As the first in a long list of economic sentiment surveys, the question remains as to whether or not those in other countries will follow:

image

Monday, November 17, 2014

Momentum Continues To Diverge From Price Action

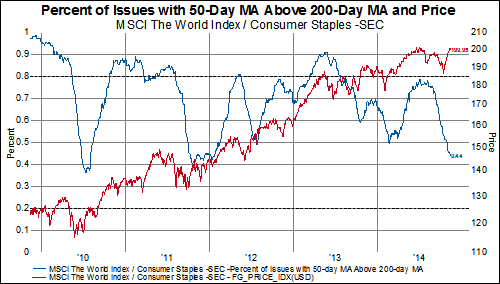
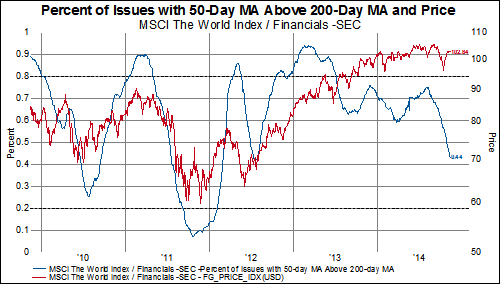
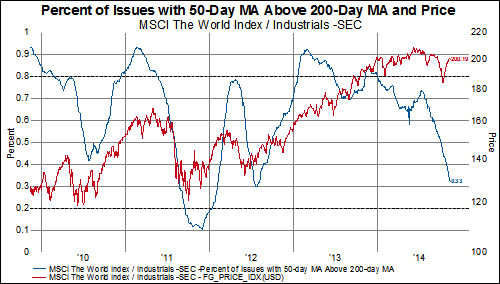
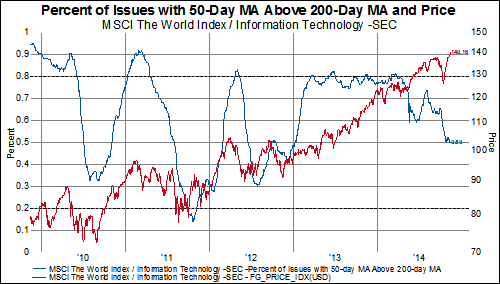
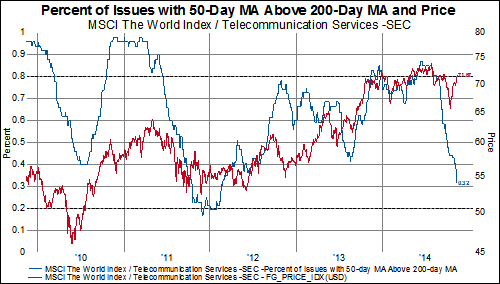
As we have noted many times before, a simple way of measuring momentum is by looking at the percentage of companies that have a 50-day moving average above its 200-day moving average. Robust bull moves tend to have a rising percentage of stocks where the 50-day moving average is higher than the 200-day moving average. Thus, when we see prices generally moving higher, as we have seen over the past few weeks, but momentum sputtering out that raises a red flag for us. When we look at the MSCI World Index by sectors, we only see one sector (health care) where the momentum isn't flashing a warning sign to us. In the other nine sectors, prices have rebounded by various degrees since the October lows, however, momentum has not turned. Charts illustrating this are below.

image

image

image

image

image

image

image

image

image

image

image