Gavekal Capital: 2015-02-08

Thursday, February 12, 2015

47% of the MSCI World Index Is In A Correction (At Least)

Regular readers know we like to slice the market internal data in a many different ways because a lot of the time the cap-weighted indices aren't a proper representation of what is going on with the majority of stocks. With this in mind, one of the ways we like to measure what is going on underneath the surface is to take a percentage of stocks that are trading at levels less than 10% off its 200-day high, 10-20% off its 200-day high, 20-30% off its 200-day high and greater than 30% off its 200-day high. By doing this, we get a good idea of what the price dispersion of stocks currently looks like. So while the MSCI World Index is basically at its all-time high, almost half of the 1600+ stocks are down 10% from its 200-day high (i.e. in a correction). Also, almost 1/4 of all stocks are in a bear market and 10% of stocks are down at least 30%.

image

image

Is Energy's Dead Cat Bounce Over?

On an equal-weighted basis, the energy sector has still been the best performing sector in February. It is nearly 7% higher this month, however, it has been the worst performing sector so far this week (-1.5%).

MSCI World Index Performance By Sector
image

Only 14% of energy stocks are positive this year but shorter term momentum has improved. Unfortunately, it has improved to the point where momentum tends to stall out. 75% of energy stocks are now trading above its 50-day moving average. 80% tends to be an unsustainable level for very long. 

image

image

Longer term momentum still looks pretty weak. Only 19% of energy stocks are trading above its 100-day moving average and only 9% of stocks are trading above its 200-day moving average.

image

image

Lastly, only 6% of stocks have a 50-day moving average trading above its 200-day moving average. This series needs to turn higher before we would feel confident that the bearish trend in energy stocks has turned. In the chart below we chart this series against the six month returns of the MSCI Energy sector.

image


Wednesday, February 11, 2015

Positive Economic Surprises in Europe, Negative in the U.S.

The Citi Economic Surprise index is a quick way to get a high-level look at the condition of economic data around the world.  Calculated as a diffusion index, values generally range between 100 and -100 for the overall index, which is currently right in the middle of that range:


In the developed market regions, there have been more positive surprises in Europe recently while Asia Pacific remains fairly neutral (though with a slight negative trend) and the U.S. has mostly seen disappointing data so far in 2015:


Tuesday, February 10, 2015

Copper Price Rolling Back Over

The price of the all important copper appears to be heading lower once again after what in retrospect looks like a dead cat bounce.


Inflation and Why China Needs it but Doesn't Have Any

The latest Chinese CPI and PPI readings were released today and showed the lowest year-over-year change in CPI since 2009 and yet another negative PPI reading (chart 1). As such, weak Chinese inflation statistics are nothing new, but the continued weakness is no doubt putting pressure on the cash flows of debt financed capital investments that need above all high nominal growth levels to stay in the positive. This may give us a hint as to why the PBOC has cut rates recently. 

Indeed, as charts 2-4 below show, fixed asset investment continues to grow at a healthy clip of about 15% annually, with construction and gross fixed capital formation reaching new heights as a percent of GDP. Meanwhile, RMB bank loans have quadrupled since 2006 (chart 5). Needless to say, there has not been a lot of rebalancing taking place in the Chinese economy. As capital stocks and the commensurate debt levels continue to grow, but increasingly accompanied by lower and lower real growth, what China needs is higher inflation, but it's not getting it. 

Whether China keeps the yuan at the current fixing or not, this is an incredible incentive for China to devalue. Of course there may be equally large incentives for China to maintain strong yuan, not least of which is to promote local currency trade settlement and financial stability, but the prospect should not be written off completely. 


Stocks Selling at a Discount to Book Value is a Thing of the Past

We suspect pegging short-term interest rates at zero for years has something to do with the fact that, for as far back as we have data, there have never been fewer stocks selling at a discount to book value. Importantly, this is a global phenomenon. There is nowhere in the world (except perhaps MSCI China, which is riddled with state-owned banks and property stocks with questionable balance sheets) where an investor can go to find an abundance of stocks selling on the cheap - not in Europe, not in Japan and not in EMs generally.


Scoring Our Point-and-Figure Charts

Last week, we went into all of the details of our proprietary point-and-figure methodology (see here).  We did not mention, however, that we evaluate each individual chart in our universe of knowledge leaders on a monthly basis, giving every one a technical 'score' based on overall trend, viability of support, and presence (or lack thereof) of significant resistance.  Relative to the MSCI ACWI, the most recent highest scores are mostly found in the Health Care sector, while Energy continues to struggle.  As we look more into the details for each region, however, we find technical leadership in other sectors such as Financials and Materials.

MSCI ACWI


10 Best Sub-Industries


10 Worst Sub-Industries


By region

Asia-Pacific


Europe


North America


EM Asia


EM EMEA


EM Latin America


(note: The absence of certain sectors in various regions is related to the lack of knowledge leaders in that particular region sector.)

Monday, February 9, 2015

Are EM Asia Equities Really That Cheap?

Several financial market commentators have recently been making the case for EM Asian stocks based on their valuation level. One of the commonly used charts is the first one below, which shows the forward 12-months price to cash flow valuation for EM Asia relative to North America. By that measure, it sure appears that EM Asia stocks are cheap!

However, when we dig into the details, we come to a considerably different conclusion. In the second chart below we show the forward 12-month (red line) and median (blue line) price to cash flow ratio for MSCI EM Asia. The forward ratio, which also happens to be market cap weighted, looks like it has barely risen off of its 2011 low. Meanwhile, the median ratio - which uses actual results and is by definition equal weighted - is nearing its high level over the last eight years.

So what gives? How can EM Asia stocks be cheap and expensive at the same time? There are three reasons for this:

  1. When we consider that North American stocks are trading at just about the highest valuation levels one could reasonable expect outside of a mania, pretty much everything looks cheap relative to them.
  2. The composition of EM Asia is heavily tilted towards capital intensive, sometimes state-owned, inefficient, commodity pass through, "old economy" stocks and financials. Those are the stocks that are cheap. Pretty much everything else - the "new economy" stuff that leverages the emerging EM consumer - is at or near its historic highs.  
  3. Forward valuation ratios use analyst estimates that are typically revised downward as the fiscal year progresses. This means the denominator starts off large and then falls, meaning the valuation level looks cheaper toward the beginning of the estimate period and the eventual realized ratio is higher.
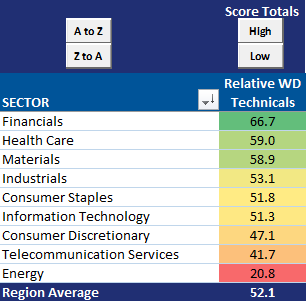
To highlight point number two above, we've shown the median company valuation level for each sector in EM Asia. The median company in Consumer Discretionary, Consumer Staples, Health Care, Industrials, and Information Technology is trading at or near its all-time high for as far back as we have data. Meanwhile, the median stock in the Energy, Financials, Materials, Telecom, and Utilities sectors is either near it's low or at least well off the high. 

There may be a case for investing in EM Asia, but valuation does not appear to be one of them unless you want to own banks or commodity pass through plays. Those areas may well be due for a cyclical rerating, but the longer term trends don't appear to be on their side. 


image

image

image

image

image

image

image

image

image

image

image

image