Gavekal Capital: 2013-10-06

Friday, October 11, 2013

Currency Checklist Suggests Stronger USD

The US Dollar (USD) has turned against the Euro...check.

image

It has turned against the GBP...check.

image

It has turned against the Yen...check.

image

It has turned against the Swiss franc...check.

image

And, lastly it has turned against gold...check.

image

BOJ Balance Sheet Keeps Increasing, but Follow Through to Real Economy is Waning

The BOJ balance sheet has increased some 39% over the last year and the monetary base has increased about 46%. But, like in the US, the Japanese banks have just been parking their excess reserves right back at the BOJ. When we adjust the monetary base for the idle excess reserves, YoY growth is less than 3%. Bank loan growth has picked up to 2% YoY, but already the first and second derivatives have turned lower.

image
image
image

North American Growth Expectations

Over the next 4 years, the Energy sector has the highest hurdle to clear in terms of growth expectations of any sector in the MSCI North American index. Looking back at the past 10 years, the double-digit sales growth expectation seems feasible. However, 17%+ growth per year in earnings would be a significant step above what this sector has achieved in the past decade.

imageimage

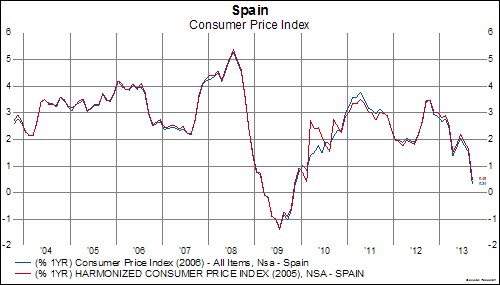
Plunging European Inflation

Inflation in the Spain and Italy is plunging at rates reminiscent of 2008-2009.

image

image

From StreetAccount:

Draghi says ECB guidance allows rate cuts on volatility: Bloomberg cited comments from ECB President Draghi, who said that the central bank’s pledge to maintain rates at low levels explicitly allows for cuts in lending costs if market volatility resumes. The article noted that ECB policy makers are looking to prevent any volatility in money market rates as it could disrupt the fragile European recovery. It also pointed out that the ECB, unlike the BoE and the Fed, has not linked its rate promise to any specific economic data. 

Back To The Beta Trade?

Over the last three months, the "beta trade" has been on.  We slice all 1,600 companies in the MSCI World index into deciles from lowest beta to highest, and then we measure the performance of each decile.  Over the last three months, the beta factor alone has explained 89% of the movement of MSCI World index stocks. While the relationship took a pause over the last month, it snapped back into gear yesterday.  We'll be watching this closely to see if it continues.  With the Citigroup Economic Surprise Index rolling over and at least one well known economist taking down 4Q GDP estimates by 1%, a period of low beta outperformance may be at hand.

image

European Equity Markets YTD

While all major European markets are currently positive so far this year, equity performance has been led by Greece, Ireland, and Spain:
image

Thursday, October 10, 2013

European Banks On A Tear

Over the last 3 months, every bank in Europe has outperformed the MSCI World Index, some by 50-70%.

image

Two-thirds of the companies sell for below book value.

image


A New Range For TIPS Yields?

Even after the non-taper and government shutdown, TIPS yields are holding at an elevated level relative to recent trends.  Have TIPS yields reset to a new range?

image

image

image


European Stock Performance Led By High Dividend Companies

Over the last month, the European telecom, utility and financial sectors have been the leadership groups within the MSCI Europe Index.

image

Interestingly, these three sectors are the highest yielding sectors in Europe.

image

Stock performance seems to reflect the strength in the Euro/USD.

image

Volatility of cyclical and counter cyclical stocks have converged

We often group stocks into either cyclical or counter cyclical baskets based on their GICS sector, and then measure the attributes of each group. The below chart shows the 20 day volatility of the counter cyclical basket of stocks relative to the cyclical basket. What we are observing is that these two baskets of stocks are exhibiting nearly the same volatility, even though the underlying risk characteristics of the groups are vastly different. In the past, peaks in relative volatility have often coincided with market tops of some significance.

image

BOE decision

Without any decisive economic data to influence its actions one way or another, the BOE opted to maintain its benchmark rate and the level of its bond-buying program:
image
image

Quest Diagnostics breaking down while market rallies

Quest Diagnostics estimated today that their 3Q EPS will be below analyst expectations. This has sent the stock lower in light of the rally today.

image

This will likely lead to a breakdown through a multi-year support level for the stock in our relative strength point and figure charts

image


The information listed above is for example purposes only and should not be construed as the Investment Advisor’s opinion or investment outlook.

Percent of companies trading near their 5 year maximum valuation level continues to grow

A similar chart to one we posted last week that showed the percent of stocks trading above their 5 year average valuation, the one below shows the percent of stocks that are trading within 25% of their highest valuation level over the last 5 years. The chart indicates that valuations are getting stretched relative to the last few years.
image

US Econ Chart of the Day: Unemployment Claims Rise

Initial unemployment claims were hit by a variety of "one-off" factors including an IT upgrade in California and temporary layoffs in the private sector due to the government shutdown. The 4-week moving average moved from 305k to 325k.

image

Citrix Systems Breaks Down on Disappointing Q3 Pre-Announcement

Today Citrix Systems is down over 11% in early trading after pre-announcing a Q3 shortfall in both revenue and earnings.

image

This will likely lead to the stock breaking down in our relative strength point an figure charts, dropping below a three year old trading range.

image

The information listed above is for example purposes only and should not be construed as the Investment Advisor’s opinion or investment outlook.


Wednesday, October 9, 2013

Stock Valuations and US Male Employment

For the last 20 years, valuations on the S&P 500 have correlated pretty well with the 25-54 year old male participation rate in the US.  The now 13-year old structural bear market in the US is easy to see.  The recent turn down in this participation rate suggest caution on equity valuations.

image

Germany Industrial Production Stronger Than Anticipated in August

Following a disappointing Industrial New Orders report yesterday, Germany's Industrial Production posted a better than expected gain for the month of August.  Will the relationship with PMI Manufacturing hold?
image

Australia Consumer Confidence and US ISM Manufacturing Index

One data point does not make a trend, but we will be watching to see if the recent down tick in Australian consumer confidence is leading the US manufacturing ISM lower.

 image

US Mortgage Applications


Mortgage applications have only slightly bounced after plunging from May to September.
image

The increase in rates YTD really hit the Refi market
image

Yen/USD and Nikkei 225

If the Yen/USD keeps strengthening, the odds of Japanese stocks rising appear slim.

image

VIX and High Yield Spreads

Over the last five years, the CBOE Volatility Index (VIX) has had an 87% correlation with high yield spreads.  If the VIX keeps rising, high yield spreads are likely to widen.

image

Tuesday, October 8, 2013

MSCI Cyclical and Counter-Cyclical Baskets

We divide the MSCI World index into cyclical (including materials, industrials, technology and consumer discretionary, financials and energy) and counter-cyclical baskets (including consumer staples, health care, telecom, utilities).  The relative performance of cyclicals vs. counter-cyclicals generally improves when the economic news is improving and contracts when it is deterioratinig.  The relative outperformance of counter-cyclicals is a one week old trend taking place alongside a one month trend in the deterioration of the Citi Economic Surprise index.

image

The drop in the non-manufacturing ISM last month (right scale inverted) could suggest a continuation of counter-cyclical relative outperformance.

image

SP500 Futures Down & VIX Rising

S&P 500 futures fall to 10 day lows this morning.

image

The VIX is close to breaking out above 20.

image