Gavekal Capital: 2014-05-04

Saturday, May 10, 2014

Median Stock Valuations Remain Near Record Highs

Measuring the valuation level of the median stock in an index can help mitigate the market-cap-weighted bias associated with many index level valuation statistics. This is important because index level valuations that are heavily influenced by a handful of large companies can give a misleading representation of prevailing valuations for most stocks.

In the below charts we show the median valuation for stocks in the MSCI World Index (red line, right axis) and compare it to the Index price (blue line, left axis). Of note is that the median stock is trading at valuation levels only seen at the previous stock market highs of 2007 and 2000.

image

image

image

image

Friday, May 9, 2014

Weak Stock Market Closes are on the Rise, but What About Strong Closes?

We've been commenting over the last few days here and here about the increasing number of weak stock market closes and how the number of weak closes seems to be closely correlated with Fed tapering of asset purchases. It seems fair enough, then, to comment on the number of strong stock market closes. In the same fashion as our GaveKal Weak Close Indicator, our GaveKal Strong Close Indicator compares the daily closing price to the daily range in which the index in question traded. If the closing price was within the top 25% of the daily range then we'd consider that a strong close. For example, if the S&P 500 trades in a 20 point range for a day and then closes 3 points from the high, we'd consider that a strong close. If the index closed 6 points from the day's high then we would not count that as a strong close. We then sum up all the strong closes over the previous six months to create our indicator.

In the chart below we can observe a descent positive relationship between the number of strong closes and stock prices. We also observe the tendency of the Strong Close Indicator to lead stock prices at important highs and lows. Today, the strong close indicator currently stands at 53 vs a high of 68 about a year ago. Our Strong Close Indicator has thus fallen considerably while stock prices have continued their strong march higher. This a simple indicator, but the decreasing number of strong closes and the increasing number of weak closes is on our radar.

image


Is the Taper Responsible for Weak Stock Market Closes?

Yesterday we highlighted here that the number of weak stock market closes was on the rise, which usually portends some bumps in the road for stocks going forward. Today we thought we'd have a look at the relationship between weak closes and Fed tapering of asset purchases. In the chart below we plot our Weak Close Indicator on the left axis (inverted) and on the right axis we plot the 3 month change in total Fed assets assuming the tapering process continues as planned. We find a pretty good inverse relationship between the rate of change in the Fed's balance sheet and the number of weak stock market closes. Said another way, when the rate of Fed balance sheet expansion increases the market sees fewer weak closes, and vice verse.

image


Japanese Leading Indicator Plunges to Lowest Level in a Year Giving Strong Recessionary Signal

The Japanese leading indicator for March (which is ironically released 40 days after month end) dropped to the lowest level in a year today (first chart). We understand that this is "old" data that was simply predicting a slowdown from the sales tax increase in April. However, what piqued our interest was the fact that the diffusion index of components of the leading indicator registered a 0%, meaning that none of the eleven components that comprise the indicator improved month-over-month. Not only has this never happened in the 24-year history of the indicator, a recession occurred within a year of every instance of the diffusion index posting a reading of 20% or less (second chart). Admittedly, we are dealing with a small sample size, but it is worth noting nonetheless.

image

image

High-Yield Debt Fuels European M&A

According to the FT, "Groups in Europe have already put €15bn in new high-yield debt to work funding mergers and acquisitions this year, compared with €9.6bn for all of last year, according to Barclays Research. Companies are spending roughly one-third of junk-rated debt on M&A, up from 12 per cent last year, with the bulk of the rest used for refinancing."
As European companies issue high-yield debt to fund deals, rates have fallen to a 15-year low and are now well below corresponding yields in the U.K. and the U.S.:

image

For more on the extensive M&A activity so far this year, see here.

The Damage In Japan

Over the last fifty days, Japan has been the weakest major stock market.  Measured by the average performance of MSCI industry groups, the average stock in Japan is down 3.71% over the last fifty days.

Performance
image

Internals are quite weak too.  Only 43% of Japanese stocks are above their 50-day average.

Percent Above Moving Average
image

Only 4% of Japanese stocks are making new 50-day highs.

Percent Making New Highs
image

Over the previous fifty days, only 35% of Japanese stocks have experienced positive performance.

Percent With Positive Performance
image

38% of Japanese stocks are 10% or more away from three month highs.

Distance From 3-Month Highs
image

Lastly, only 27% of Japanese stocks have outperformed the MSCI World index over the last 50 days.

Percent Outperforming MSCI World
image


Thursday, May 8, 2014

Weak Stock Market Closes Are On the Rise

We've taken note of an increasing number of weak-ish stock market closes and decided to build an indicator to measure the number of weak closes and compare it to stock prices. The indicator counts the number of times over the last six months in which stocks closed in the bottom quartile of their daily trading range. For example, if the S&P 500 trades in a 20 point range during the day and closes 4 points from the low, we would count that as a weak close. Generally, we see the number of weak closes decline during rallies and expand during selloffs, which makes sense. The indicator usually follows stock prices except at major turning points when it sometimes leads stocks in one direction or the other. We mention this because we are currently seeing a rather large divergence between the weak close indicator and stock prices. The indicator has been heading lower since the middle of 2013 while stock prices have continued their upward march. The divergence is prominent for the US and Japanese indices, but less so for the STOXX 600. Note that in the charts below the weak close indicator is plotted on the left axis and it is inverted.

image

image

image

image

image

image

image


To Say That Small Caps Are Under Performing Would Be A Generous Statement

Despite (or maybe because of?) "pockets where we could potentially see misvaluations in smaller-cap stocks", the small caps have been taking it on the chin of late. Indeed when we break down the S&P 1500 into it's large, mid and small cap components there seems to be an obvious bias toward selling the "smaller cap stocks". The way we are gauging selling pressure in this instance is to measure the percent of stocks in each index that are either in correction territory (down at least 10% from the 1-year high) or in an outright bear market (down at least 20% from the 1-year high). The results (below) pretty much speak for themselves as the link between cap size and selling pressure is unmistakable. We wonder when or if the selling pressure in "smaller cap stocks" will feed into "larger cap stocks" and whether those "misvaluations" are as confined as the Chairwomen says they are.

Large Caps
Percent in Correction Territory = 21.4%
Percent in Bear Market = 8.6%
Percent in Correction or Bear Market = 29.9%
image

Mid Caps
Percent in Correction Territory = 35.0%
Percent in Bear Market = 15.0%
Percent in Correction or Bear Market = 50.0%
image

Small Caps
Percent in Correction Territory = 36.2%
Percent in Bear Market = 34.2%
Percent in Correction or Bear Market = 70.3%
image

Energy Is Flying High This Quarter

Energy stocks have dominated the market so far during the 2nd Quarter (and to an extent so far this year). The average Energy stocks is up over 5% QTD compared to the average stock which is actually slightly negative (-0.4)

image

95% of the Energy stocks are trading above their 65-day moving average as well as 31% are trading at 65-day highs. At the other extreme are IT stocks. Only 36% of stocks are trading above their 65-day moving average and only 3% of stocks are at 65-day highs.

image

97% of Energy stocks are within 10% of their 3-month high and zero stocks are greater than 20% from their 3-month high. This is in stark contrast to IT stocks where 10% of the stocks are in a bear market over the past three months.

image

An impressive 87% of Energy stocks are outperforming the MSCI World Index over the last three months. Utilities is actually the clubhouse leader in this statistic with a whopping 95% of stocks outperforming the MSCI World Index.  Only 34% of Health Care stocks have outperformed over the last three months.

image

Energy has the highest average sales growth expectations over the next four years (8.5%) and the second highest average EPS growth expectations (16%). Energy has also had the smallest decline in FY1 EPS estimates over the past three months. On average, EPS estimates have dropped by 1.9%. Energy EPS estimates have fallen only by about half of that (-0.9%).

image

image

Wednesday, May 7, 2014

Solving the Mystery of Why the Yen has not Fallen More

After undergoing a fairly rapid depreciation from the end of 2012 to mid-2013 the yen has traded in a more or less sideways channel and has recently been parked between 101-104 per USD. Given the monetary largess provided by the Bank of Japan, this has come as a surprise to many Japan watchers who expected the yen to fall much further. So why hasn't the yen met those expectations even as it becomes crystal clear that the BOJ is running the easiest monetary policy of any major central bank? Well, in a world of zero interest rates and low inflation it may just be that the most important factor behind currency moves boils down to nothing more than the relative quantities of money in each currency, which in turn boils down to the relative size of each central banks' balance sheets.

In the chart below we plot the JPY/USD exchange rate on top of the ratio of total assets held by the BOJ relative to total assets held by the Fed. For the remainder of 2014 and 2015 we have made a low and a high forecast for where this ratio is likely to end up given what we know about about BOJ and Fed policies. For the low forecast we've assumed that the BOJ continues at the current pace of accommodation by buying ¥70tn in assets in 2014 and 2015 (more or less the stated policy). The high forecast assumes the BOJ doubles down on QE and buys assets at an annual pace of ¥140tn starting in November of this year. Both forecasts assume the Fed will conclude the tapering process in December 2014.

What we see is that the JPY/USD exchange rate has for the most part followed the path of the relative size of the central banks' balance sheets. From 2007-2012 the Fed was clearly out-QEing the BOJ and the yen rose from 120 to 75. When the BOJ voiced its intention to join the global currency war at the end of 2012 the market immediately discounted a reversal of that trend by pushing the yen back down towards 100, even though the level of eventual monetary accommodation was not entirely clear at the time. Based on this model it even appears as though all stated BOJ asset purchases through 2015 are currently discounted, as our low forecast for this ratio would have the yen at a little under 100 per USD. This phenomenon might go a long way in explaining why the yen hasn't fallen further. If however, the BOJ decides to come out guns blazing and double up on asset purchases sometime later this year (our high forecast), then JPY/USD of 120 would seem warranted.

image

Is European Industrial Machinery Headed for a Breakdown?

The volume of new orders received by German industrial firms unexpectedly fell in March, according to data released today:

image

In contrast to expectations for a slight rise (+0.3% m/m), the -2.8% m/m decline was led by a steep decline in export orders and, in particular, those from other Euro Area countries (-9.45% m/m):

image
image

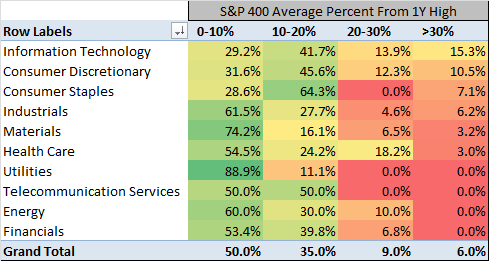
Among Industrial groups whose foreign sales makes up more than 75% of total sales, performance was flat to negative over the last month:

image

Sales growth estimates have fallen, on average, over the last three months.  Particularly striking is the nearly 10% decline in sales growth expectations for the Industrial Machinery sub-industry:

image

Furthermore, our point-and-figure work suggests that the European Industrial Machinery group is at somewhat of a crossroads:

image

Such weakness in orders in what is arguably the strongest economy in Europe is not very encouraging.

Warning Sign: Number Of 1% Down Days Are Ticking Up And Tracking Taper

One of the many technical data points that we look at is the 6-month moving sum of days where either the index or an individual stock finishes down by 1% or more. The MSCI World Index has now had 7 days in the past six months (compared to only 2 days at the beginning of the year) and The MSCI North America Index has had 9 days in the past six months (compared to only 5 days at the beginning of the year). What is particularly interesting is how well this data point correlates with the level of the Federal Reserve's balance sheet. In the charts below, the red line is the 3-month difference in total Fed assets with a simple projection using the assumption that the Fed continues to taper an additional $10 billion in asset purchases at each meeting. What becomes clear quickly is that if this relationship holds than there are many more 1% down days in the near future. Below are charts of the MSCI World, MSCI North America and selected stocks.

image

image

image

image

image

image

image

image

image

image

image

image

image

image

The above mentioned securities may be in our current portfolio. Please refer to website for a current list of our holdings-  http://www.gavekalcapital.com/ucitsfundtop20.php