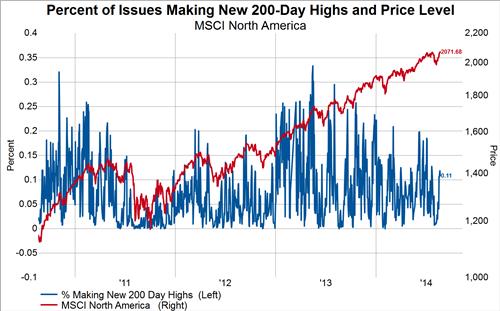
Earlier this week we touched on the fact that new highs in individual stocks have not expanded much despite the continued new highs all year in the headline indices. This phenomenon is seen most clearly in the MSCI North America (the divergence in Europe has been corrected), which made a new all-time high yesterday that failed, again, to be accompanied by a higher level of new highs in individual stocks than occurred at the previous breakout. In our post from Monday we stated,
"Time will tell if the MSCI North America catches down to the level of new highs or if new highs finally expand on the next major break to higher prices." Well, with yesterday's action we still can't answer this question as the divergence has been prolonged once again.
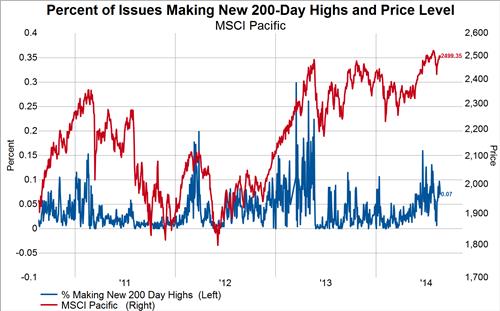
The below charts show the percent of stocks making new 200-day highs (blue line, left axis) overlaid on the price of the index being measured (red line, right axis).


