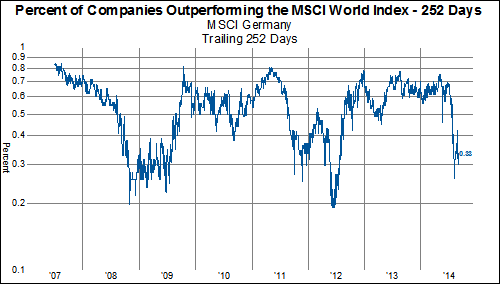
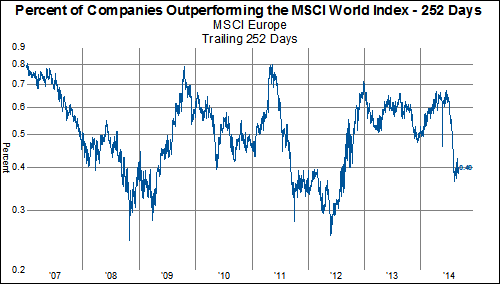
One such breadth measure is looking at performance of a country index constituents relative to the entire MSCI World Index. In the charts below, we plot the percentage of stocks in a country that have outperformed the MSCI Index over the past year (252 trading days).
The MSCI UK had performed much better from a breadth perspective than the MSCI Germany and MSCI France indices since the Great Recession. However, the sickness of European equities seems to have affected the MSCI UK lately. The MSCI UK, which has actually performed better from a performance standpoint than the rest of Europe (figure 3), has just 36% of stocks outperforming the MSCI World index. This is the fewest number of stocks outperforming since April 2009. The absolute number of stocks outperforming in the MSCI France and MSCI Germany currently only stands at 33% and is still below the level of the MSCI UK. However, from a recent historical perspective these two country indices had fewer stocks outperform in 2012 than the UK had so their weakness isn't as surprising. Finally, overall only 40% of all MSCI Europe stocks have outperformed the MSCI World index over the past year which is definitely a change in the trend of the past two years. At one point in late 2012, 71% of MSCI Europe stocks were outperforming the MSCI World Index.
Figure 1 - MSCI World Equity Performance By Sector

Figure 2 - MSCI Europe Equity Performance By Sector
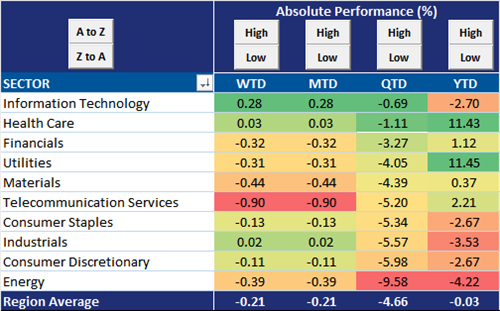
Figure 3 - MSCI UK Equity Performance By Sector