
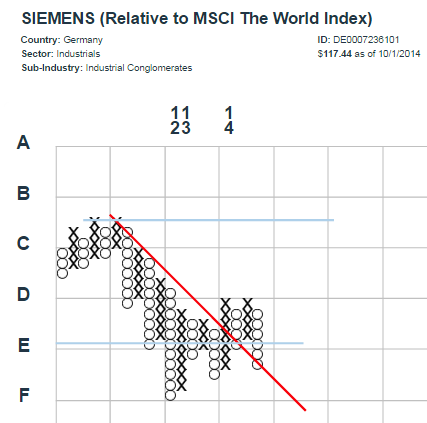
1. continuous, substantial relative underperformance-- by more than 30%, in some cases.
2. little to no warning and in the midst of otherwise positive trend characteristics (breakouts from multi-year bases, strong uptrends that have tested support).
3. there is little support or hope for a quick recovery.
A few examples, keeping in mind that each 'x' or 'o' represents a 2.5% relative outperformance or underperformance, respectively:


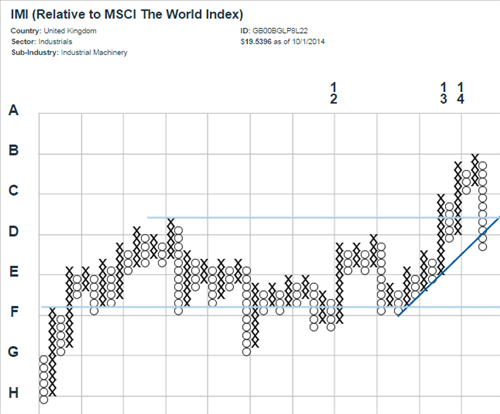

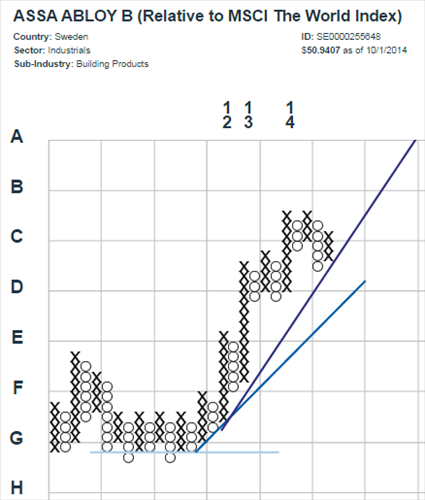
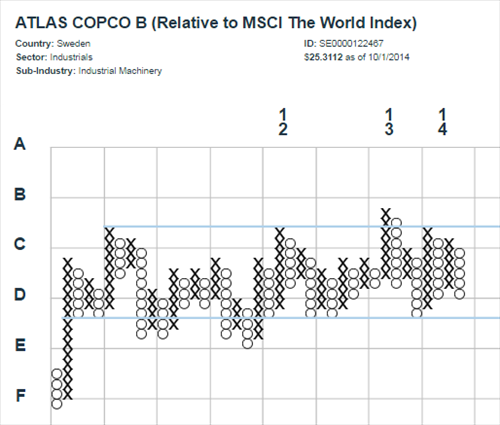
The concern here is that other constituents of the group also begin to breakdown and violate important areas of support in a similarly abrupt fashion. Some candidates to watch for?
Testing high performance (dark blue line) support here, with quite a bit of room to fall before reaching the 45-degree bullish support line (lighter blue):
This looked like a breakout, until...:

This multi-year trading range seems more likely to resolve its indecision with a move down (see Alfa Laval, above):
Another failed attempt to sustain an uptrend out of a multi-year base of support?:
