In the first chart below we show the cumulative number of net advancing stocks over the last two years (basically it's an Advance/Decline line that is calculated over the last 504 trading days, rather than some arbitrary starting point like most A/D lines) and compare it to the MSCI World Index price. The takeaway here is that stocks have advanced back to near their all-time highs, but our A/D line has continued to head in the opposite direction despite the recent blip higher.

This next chart shows the percent of all stocks making a new 65-day high and compares it to the price of the MSCI World Index. The blue line (our technical indicator) has not made a new high since last October and in fact keeps making lower highs and lower lows. So far we have seen more of the same in this latest buy-the-dip episode (i.e. the percent of stocks making a new 65-day high has not expanded all that much while the aggregate stock market is back near the all-time high).

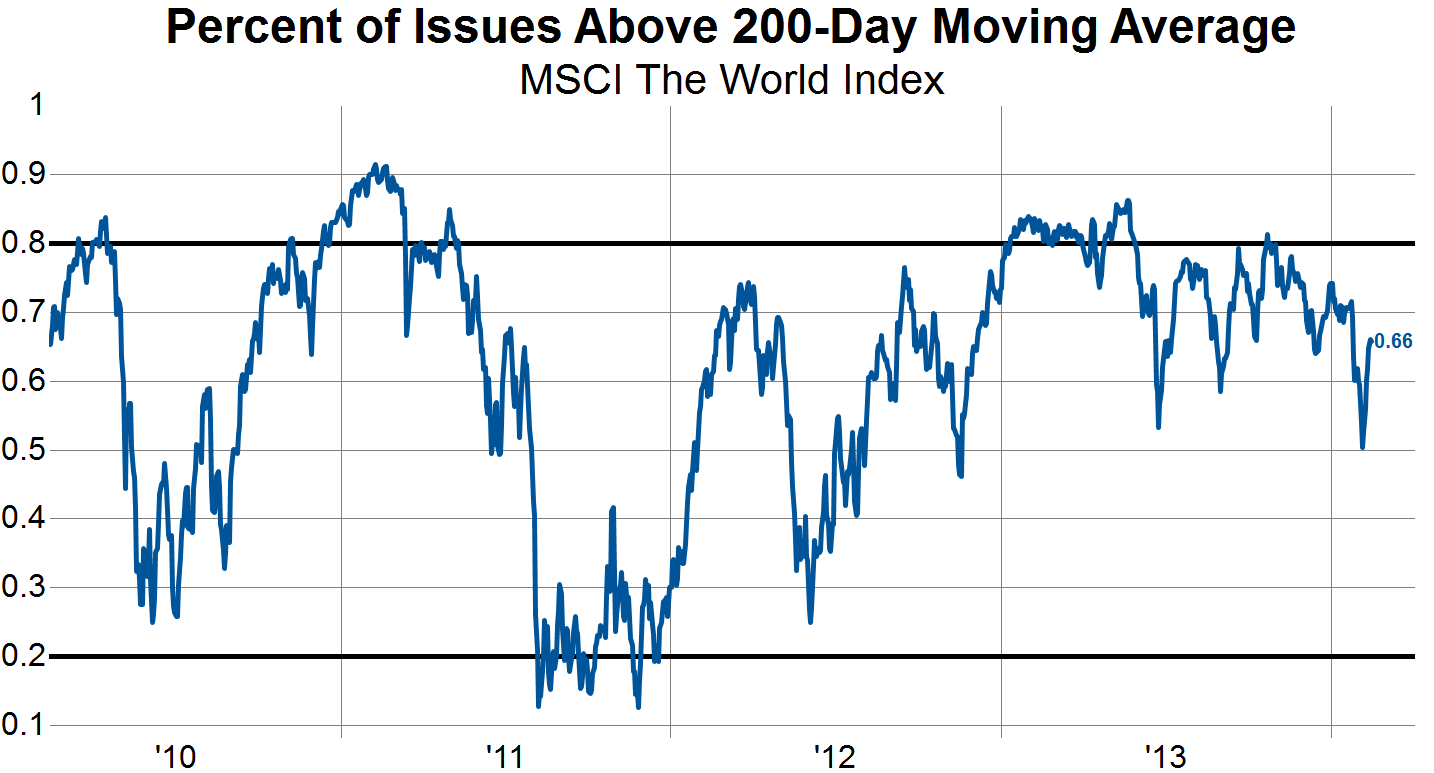
The final chart in this post shows the percentage of stocks trading above their respective 200-day moving average. We see that this indicator peaked out towards the beginning of 2013 and has since seen a series of lower highs and lower lows. The latest rally has so far failed to bring this indicator back to the previous high made in early January.
These technical breadth indicators are by no means timing tools, but they do shed light on the broad participation in rallies or declines in the stock market. We are currently seeing many of these breadth indicators failing to confirm the most recent rally in stocks, which signals that fewer stocks are displaying strong trends than was previously the case. This is the same sort of pattern that occurred in 2011 and thus some caution is warranted as broad indices race higher.

