The academic literature uses the analogy of a drunk stumbling along
as the basis to illustrate the hypothesis that the movement of stock prices is
totally random. The story goes that the
drunk is just as likely to take a step in one direction or another, and the
direction of that next step is impossible to predict. This uncertainty regarding the next step is
used to suggest that it is impossible to predict which way he he will step
next, so why try to guess. Replace the
drunk taking a step with the direction of stock prices tomorrow and the theory
goes that it is impossible to predict stock prices. Fair enough. We agree; it certainly is
impossible to predict the direction of stock prices tomorrow. It is assumed that each step the drunk takes is of equal size, so
that over time, his steps cancel each other out and he ends back where
began. In other words, the price of a
stock will go on a random walk and not necessarily result in gains. But, what if the steps the drunk takes are of
unequal size? What if every step north
is 3 feet, while every step south is 1 foot.
While we couldn’t guess which direction each next step will be, we can
measure that over time he is generally moving north at a rate of 2 feet per
step on average. The efficient market hypothesis makes a critical assumption that
all of the drunks steps are the same size, i.e. that they follow a normal,
bell-shaped curve distribution.
In contrast to a normal distribution, the histogram for a non-normal set of observations is not symmetrical or bell-shaped. These kinds of configurations are described with variables such as skew and kurtosis and are frequently (though not always) related to data involving time measurements. Examples of non-normally distributed data include the waiting time at a doctor’s office, the price movement of an individual stock, or the cumulative earnings associated with a lifetime of work in a given profession.
The skewness of a distribution refers to a lack of symmetry. A histogram with negative skew has data that is skewed to the left while one with positive skew has more observations in the right tail. Generally, if skewness is less than -1 or greater than +1, the distribution is highly skewed; skew values between -1 and -½ or +½ and +1 are considered moderately skewed; and skewness between -½ and +½ indicates an approximately symmetric distribution.
Kurtosis is used to describe the extent to which a set of data is more or less “peaked” when compared to a normal distribution (with kurtosis of 0). Higher kurtosis (>0) is associated with the movement of observations toward the center and the tails of the distribution (i.e. out of the “shoulders”) while the opposite is true for a distribution with kurtosis <0.
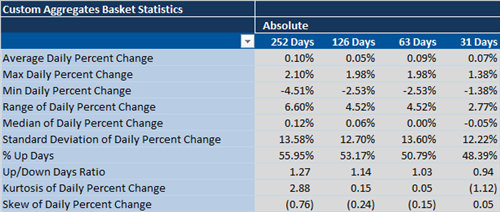
We measure the average daily percent change for all stocks in the MSCI World Index and aggregate the results. In an upward trending market, we generally observe a negative skew and positive excess kurtosis. In downward trending market, we generally observe a positive skew and negative excess kurtosis. In last 31 days, the distribution of daily returns within the MSCI World Index has shifted to a negative configuration of a positive skew and negative excess kurtosis. This divergence suggests the underlying structure of the equity market is in flux. The nature of the drunk's steps are changing.