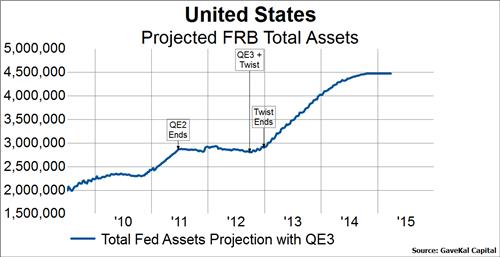
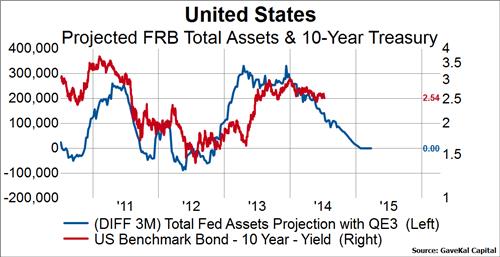
While academic literature exists that suggests the key variable in QE is the level of Fed assets, our own empirical analysis over the last few years suggests the flow of purchases is the key variable affecting at least stocks and bonds. To illustrate this point we overlay the flow of assets and the likely course of flows (which we have termed our "Taper Model") from the second chart onto various bond and stock variables.


In the below two charts we show our Taper Model (blue line) overlaid against the United States 10-year treasury yield (first chart) and 10-year TIPS yields (second chart). We can clearly see that over the last four years the rate of change in Fed assets has been positively correlated to both nominal and real bond yields. As the flow of assets has increased, bond yields have tended higher, and vice versa.


In the next three charts we overlay our Taper Model (the red line this time) on a few stock market variables. The first chart shows the MSCI World Index, the second shows the percent of stocks in the MSCI World Index above their own 200-day moving average, and third shows the performance of counter-cyclical stocks relative to cyclical stocks across the MSCI World Index. From these examples we can see that the flow of asset purchases appears to be positively correlated with stock prices (first chart), stock market breadth (second chart), and cyclical leadership (third chart).


Conclusion:
The Fed has clearly laid out its plans for the termination of QE. This allows us to project both the level of Fed assets and the flow of asset purchases through the remainder of the program and opine about the most likely scenarios for bonds and stocks. Our experience with QE suggests that the flow of asset purchases is the key variable affecting bond and stocks. Given that we have observed positive relationships between the flow of asset purchases and bond yields, our Taper Model suggests lower nominal and real yields in the months ahead as the flow slows to $0. Similarly, the Taper Model suggests a more defensive stance is warranted toward stocks as the model points to lower stock prices, deteriorating stock market breadth, and counter-cyclical leadership.
