In the tables below, we are looking at aggregated, company level data. So for example in Figure 1, it is the total level of cash for all companies in the MSCI North America Index (ex-financials) divided by the total level of capital for all companies in the MSCI North America Index (ex-financials).
One of the most striking trends that emerges when analyzing this aggregated data set is the difference in how large companies in North America are financing their balance sheet compared to smaller companies. If you look at only the largest 100 companies based on market cap in the MSCI North America Index out of the possible 713 total companies (the largest 100 account for over half of the total market cap in the index), you find that the largest firms have been accumulating and holding more cash than their smaller counterparts in recent history.
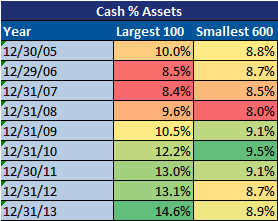
For example, in 2005 15.7% of the largest 100 companies' capital was in cash. Similarly, the other 600 companies had a cash to capital ratio of 13.9% (Figure 1). Nine years later the smallest 600 companies continue to hold about 13.4% of their capital in cash (Figure 1). However, for the largest 100 companies their cash to capital ratio has significantly increased to 22.2% or increased by 41.1% since 2005. Not surprisingly then, their net debt as a % of capital ratio has declined for the largest 100 while for the smallest 600 it has remained relatively the same (Figure 2). Larger companies also have more equity as a % of capital than smaller companies (Figure 3). Finally, larger companies have experienced a significant increase in cash as a % of their total assets (Figure 4) while we have seen no such increase for the smallest 600.
Figure 1

Figure 2

Figure 3

Figure 4