

Taken in aggregate, sector valuations in MSCI Europe currently trade at anywhere from a 20% to a 60% premium over the MSCI World average.

The story is the same when we look at valuations compared to their respective averages over the last decade-- European equities trade somewhere between 20-40% higher.

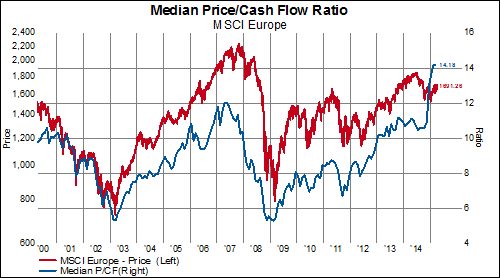
Taking a more granular look at the Industry Groups in Europe over the last ten years, we can see just how much P/CF valuations have expanded (red is high, green is low).

The last time valuations were even remotely close to being this high for the majority of constituents was in 2005/2006.