
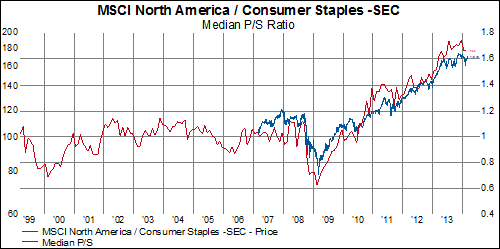
The median P/S ratio in the MSCI World is 1.73x. This is exactly equal to the high in 2007 and higher than the high seen in 2000 (which was 1.53x). In Europe, median P/S currently is about 10% below the high seen in 2000 and about 20% below the high in 2007. For Asia-Pacific, median P/S currently is currently about 20% higher than in 2000 but about 15% lower than the high in 2006. Finally, in North America, we find that current median P/S sales higher than the highs in 2000 or 2006.


When we dig into North America by sector, we really can see where the richest valuations are because the sectors are trading at different historical levels. Here are the sectors trading at nearly all-time P/S multiples (consumer discretionary, consumer staples, health care, industrials, and utilities).


This second group, made up of hyper-cyclicals and late-cyclicals, have not experienced the multiple expansions that the previous group has had.


