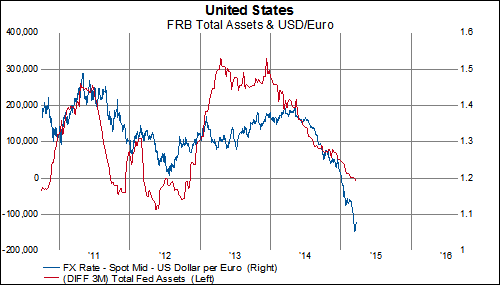
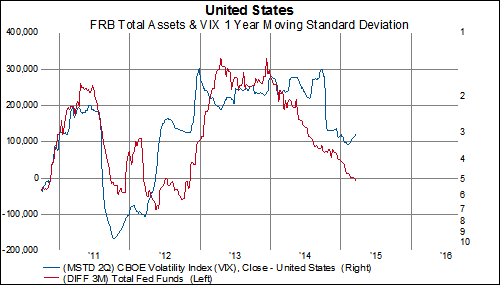
Throughout QE3, one of our favorite charts to look at was the three-month change in total fed assets. You could overlay this series with
bonds or
stocks or other economic indicators and find some interesting relationship.
On March 6th, for the first time since November 2012, the three month change in total Federal Reserve assets declined.


If this trend continues, then we would probably expect to see a lower 30-year treasury yield in the US...

And a higher Fed Funds Rate...

And a lower Euro...

And a pickup in equity volatility...

And a further slowdown in global manufacturing...

And an increase in long-term macro risks


