
We first note that the percent of stocks trading above their 50-day moving average currently stands at 27%. Good lows that have led to large subsequent gains have seen less than 20% of stocks trading above their medium-term moving average.

The percent of stocks making new 50-day lows, which usually spikes when emotions run high, reached 30% on yesterday's selloff. We'd prefer to see a reading of closer to 50% to signal that the majority of the rout is behind us.

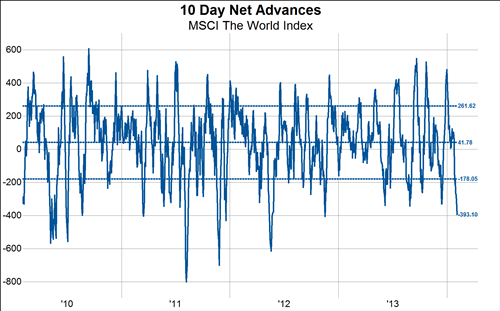
The 10-day moving average of the number of advancing stocks minus the number of declining stocks stands at -393 compared to readings under -500 at the best emotional lows of the last 4 years.
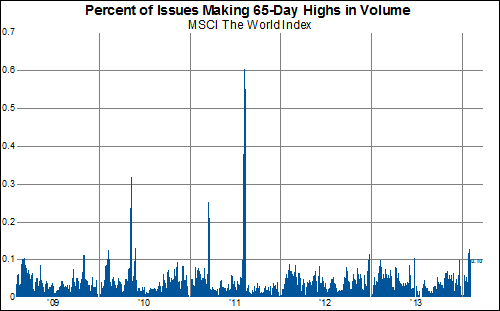
The percent of stocks making new 65-day highs in volume has elevated to 10% over the last few days, but is nowhere near the readings of >30% we saw at the good lows of 2010 or 2011.
So, while we are getting closer to something we'd consider an oversold condition (which by the way can persist for quite awhile) our battery of indicators still suggests we are not there yet.